
|
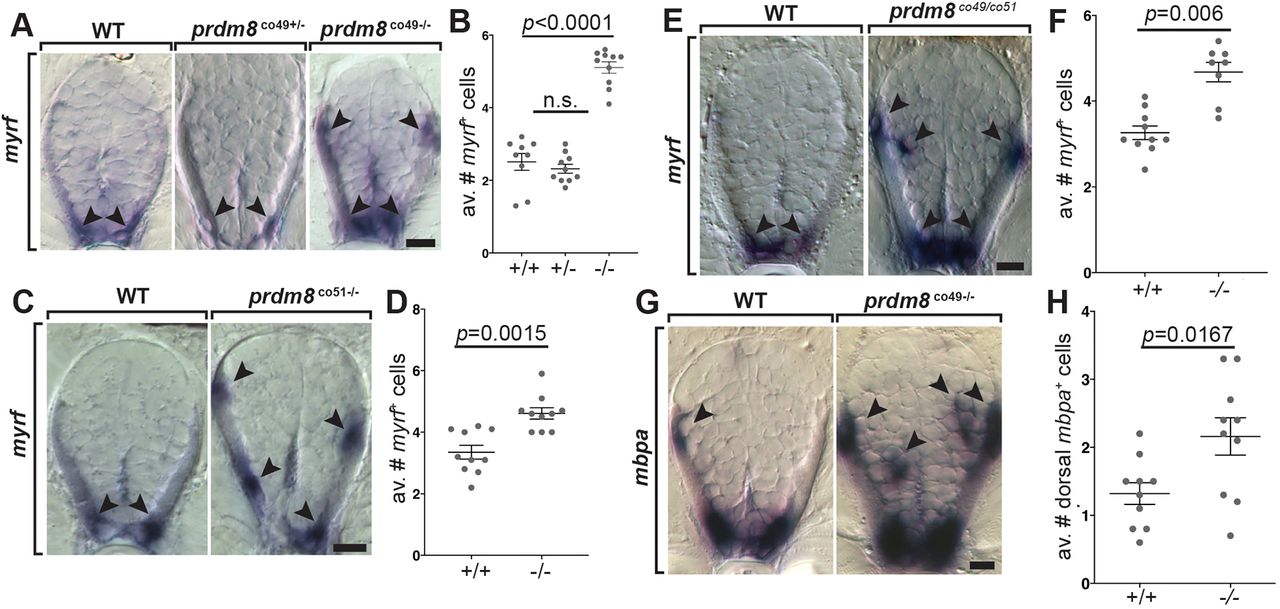
Fig. 4 prdm8 mutant larvae have excess oligodendrocytes. (A,C,E,G) Representative trunk spinal cord transverse sections obtained from 72 hpf larvae showing mRNA expression patterns detected by ISH. Images and quantification of myrf expression in wild-type (WT), heterozygous and homozygous co49 mutant larvae (A,B), wild-type and homozygous co51 mutant larvae (C,D), and wild-type and co49/co51 mutant larvae (E,F). Arrowheads mark myrf+ oligodendrocytes. (G,H) Images of mbpa expression and quantification of dorsal mbpa+ oligodendrocytes in wild-type and homozygous co49 mutant larvae. Arrowheads denote mbpa+ oligodendrocytes. n=10 larvae for each genotype except wild type in B (n=9) and co49/co51 mutant larvae in F (n=8). Data are mean±s.e.m. with individual data points indicated. Statistical significance was evaluated by Mann–Whitney U test (B,D,F) and an unpaired, two-tailed Student's t-test (H). n.s., not significant. Scale bars: 10 μm.