IMAGE

Fig 7

ID
ZDB-IMAGE-200829-100
Source
Figures for Wilson et al., 2020
Image
Figure Caption

Fig 7 Structural analysis of MTP mutations.

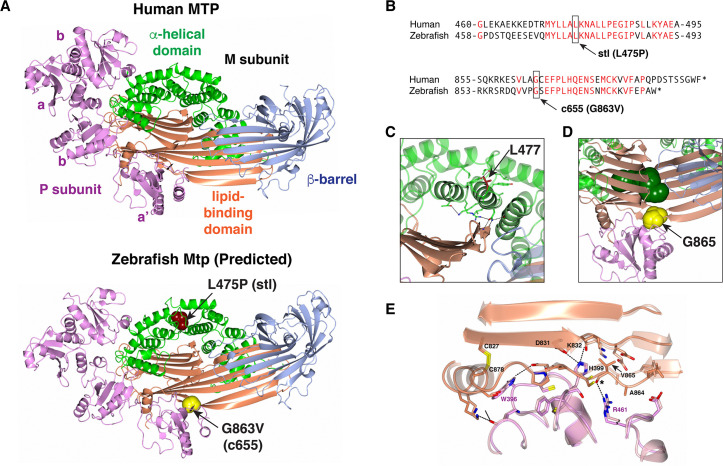
(A) Ribbon representation of the human MTP complex (PDB entry 6I7S) and the Zebrafish modeled structure. The positions of L475 and G863 in the Zebrafish structure are shown in space-filling representation. (B) Alignment of human MTP and zebrafish Mtp amino acid sequences surrounding the stl and c655 mutations. (C) Close-up view of the area surrounding L477 in the human MTP complex. The position of L477 (red) is highlighted. The conserved hydrogen bonds linking the helical domain to the tip of the C-sheet of the lipid-binding domain are shown as well as amino acids within 4Å of L477. (D) Close-up view of the area surrounding G865 in the human MTP complex. The position of G865 (yellow) and the PEG molecule (dark green) which occupies the lipid-binding site in the solved structure are shown in space-filling representation. The a’ domain of PDI (pink) in the complex occludes the lipid entry/exit site. (E) Close-up view showing the outer strand displacement in sheet A of the lipid-binding domain of the M subunit resulting from the G865V mutation. Asterisk indicates the wild-type backbone carbonyl of G865 hydrogen bonded to R461 of PDI. Panels C–E are colored as in panel A.

Acknowledgments
This image is the copyrighted work of the attributed author or publisher, and ZFIN has permission only to display this image to its users. Additional permissions should be obtained from the applicable author or publisher of the image. Full text @ PLoS Genet.