IMAGE

Figure 2

ID
ZDB-IMAGE-200824-9
Source
Figures for Ito et al., 2020
Image
Figure Caption

Figure 2

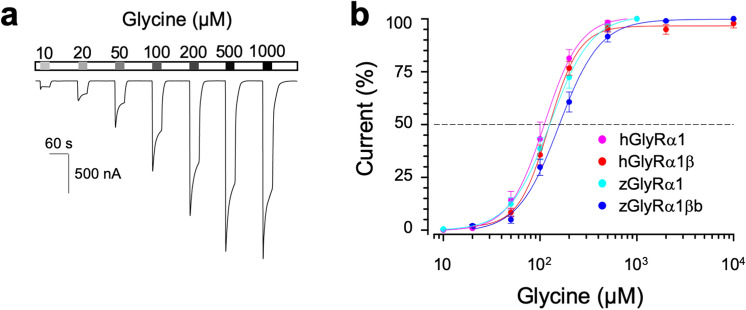
Heteromeric GlyR decreased glycine sensitivity compared with homomeric GlyR. (a) A trace of two-electrode voltage-clamp recording from oocyte injected with five femtomoles of zGlyRα1 cRNAs exposed to serial application of glycine of increasing amounts. (b) Cumulative concentration–response relationship of glycine-evoked currents. The amplitude of glycine-evoked currents was normalized to the maximally-evoked current as 100% for each oocyte (n = 10). Values here and elsewhere represent mean ± SEM.

Acknowledgments
This image is the copyrighted work of the attributed author or publisher, and ZFIN has permission only to display this image to its users. Additional permissions should be obtained from the applicable author or publisher of the image. Full text @ Sci. Rep.