IMAGE

Fig. 1.

ID
ZDB-IMAGE-200822-37
Genes
Source
Figures for Singh et al., 2020
Image
Figure Caption

Fig. 1.

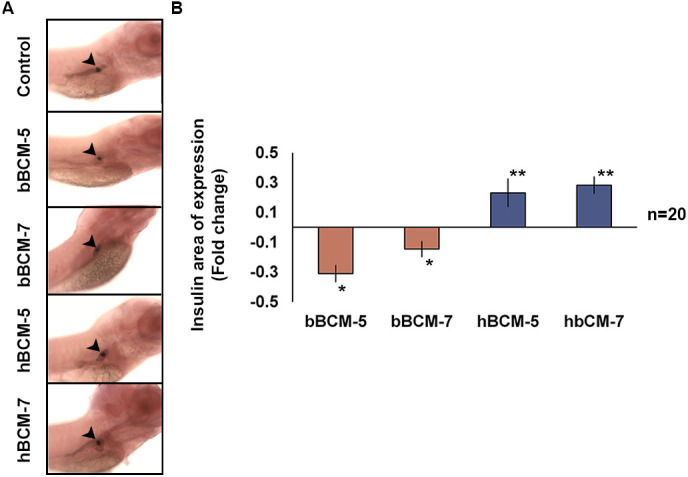
WISHto analyse the effect of chronic β-casomorphin exposure on insulin domain of expression. (A) Insulin domain of exposure (black arrowheads) in WT zebrafish embryos exposed to 50 µg/ml of bBCM-5, bBCM-7, hBCM-5 and hBCM-7 from 3–6 dpf. (B) Statistical analysis of insulin domain of expression using Student's t-test. Fold change (compared to untreated control zebrafish embryos) shows insulin domain of expression significantly decreased following bBCM-5 or -7 exposure and significantly increased following hBCM-5 or -7 exposure. Data represent mean±s.e.m.; *P<0.05, **P<0.005; Student's t-test (n=20).

Figure Data
Acknowledgments
This image is the copyrighted work of the attributed author or publisher, and ZFIN has permission only to display this image to its users. Additional permissions should be obtained from the applicable author or publisher of the image. Full text @ Biol. Open