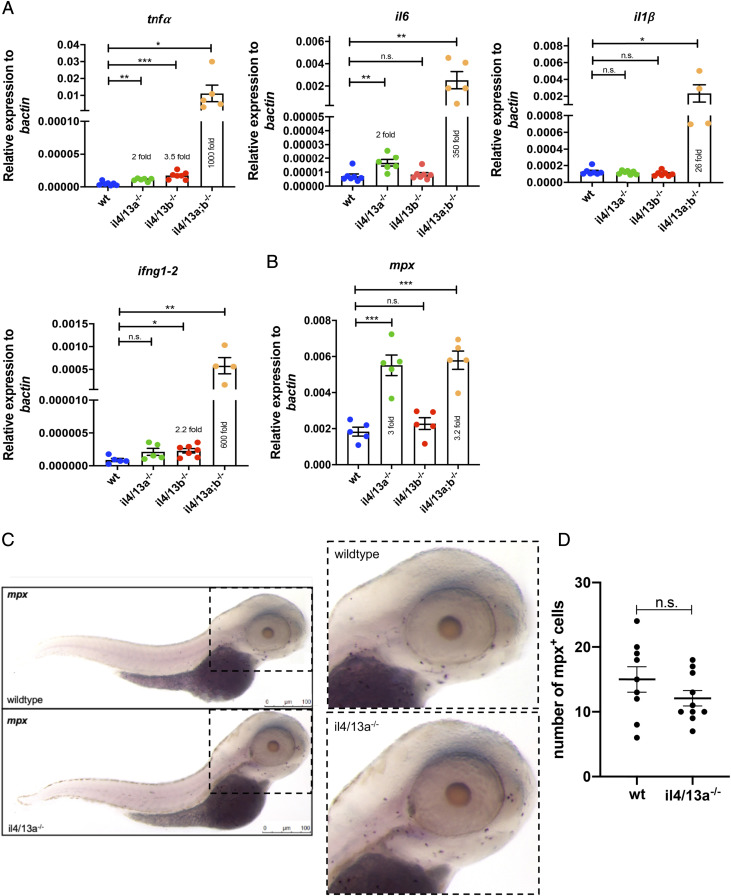
IMAGE

Fig. 2

ID
ZDB-IMAGE-200817-23
Genes
Source
Figures for Bottiglione et al., 2020
Image
Figure Caption

Fig. 2

Increased levels of proinflammatory cytokines in il4/13a;b−/− larvae. (A and B) qPCR analysis showing levels of il1β, il6, tnfα, ifng1–2, and mpx mRNA in wildtype, il4/13a−/−, il4/13b−/−, and il4/13a;b−/− 5 dpf larvae. Dots indicate individual fish. Gene expression was normalized to the expression of β−actin. Error bars represent SEM; n > 3, *p < 0.05, **p < 0.01, ***p < 0.001. (C) Representative image of mpx in situ hybridization in wildtype and il4/13a−/− 3 dpf larvae (n = 9–10). Purple dots indicate mpx+ cells. Scale bar, 100 μm. (D) Quantification of mpx+ cells in wildtype and il4/13a−/− larvae head region. Dots indicate individual fish.

Figure Data
Acknowledgments
This image is the copyrighted work of the attributed author or publisher, and ZFIN has permission only to display this image to its users. Additional permissions should be obtained from the applicable author or publisher of the image. Full text @ J. Immunol.