IMAGE

FIGURE 5

ID
ZDB-IMAGE-200808-7
Source
Figures for Westhoff et al., 2020
Image
Figure Caption

FIGURE 5

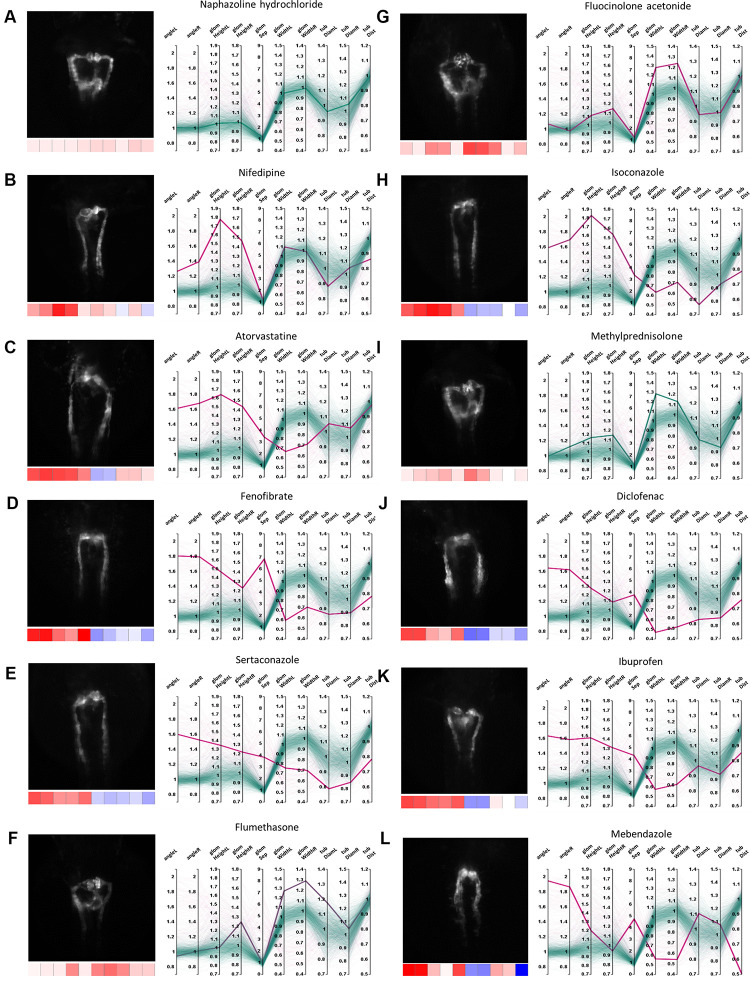
Examples of pronephric phenotypes. Illustrative examples of drug induced phenotypic changes for several compound classes. For each compound a thumbnail image, a heat map z-score visualization (below thumbnail) and a parallel coordinates plot of fold changes of quantitative morphological features are shown. In the parallel coordinates plots, thick lines indicate the shown compound and thin lines represent all other compound treatments; color codes as in Figures 3, 4. (A) Naphazoline hydrochloride (class, sympathomimetics); showing no effect (please see Supplementary Figure S5 for DMSO-only control), (B) nifedipine (class, dihydropyridine derivatives), (C) atorvastatine (class, HMG CoA reductase inhibitors), (D) fenofibrate (class, fibrates), (E) sertaconazole (class, imidazole and triazole derivatives), (F) flumethasone (class, corticosteroids, moderately potent (group II)), (G) fluocinolone acetonide (class, corticosteroids, potent (group III)), (H) isoconazole (class, imidazole derivatives), (I) methylprednisolone (class, glucocorticoids), (J) diclofenac (class, acetic acid derivatives and related substances), (K) ibuprofen (class, propionic acid derivatives), and (L) mebendazole (class, benzimidazole derivatives). Permission to reuse and Copyright: It is made available under a CC-BY-ND 4.0 International license.

Acknowledgments
This image is the copyrighted work of the attributed author or publisher, and ZFIN has permission only to display this image to its users. Additional permissions should be obtained from the applicable author or publisher of the image. Full text @ Front Cell Dev Biol