IMAGE

Figure 3.

ID
ZDB-IMAGE-200807-6
Source
Figures for Ghosh et al., 2020
Image
Figure Caption

Figure 3.

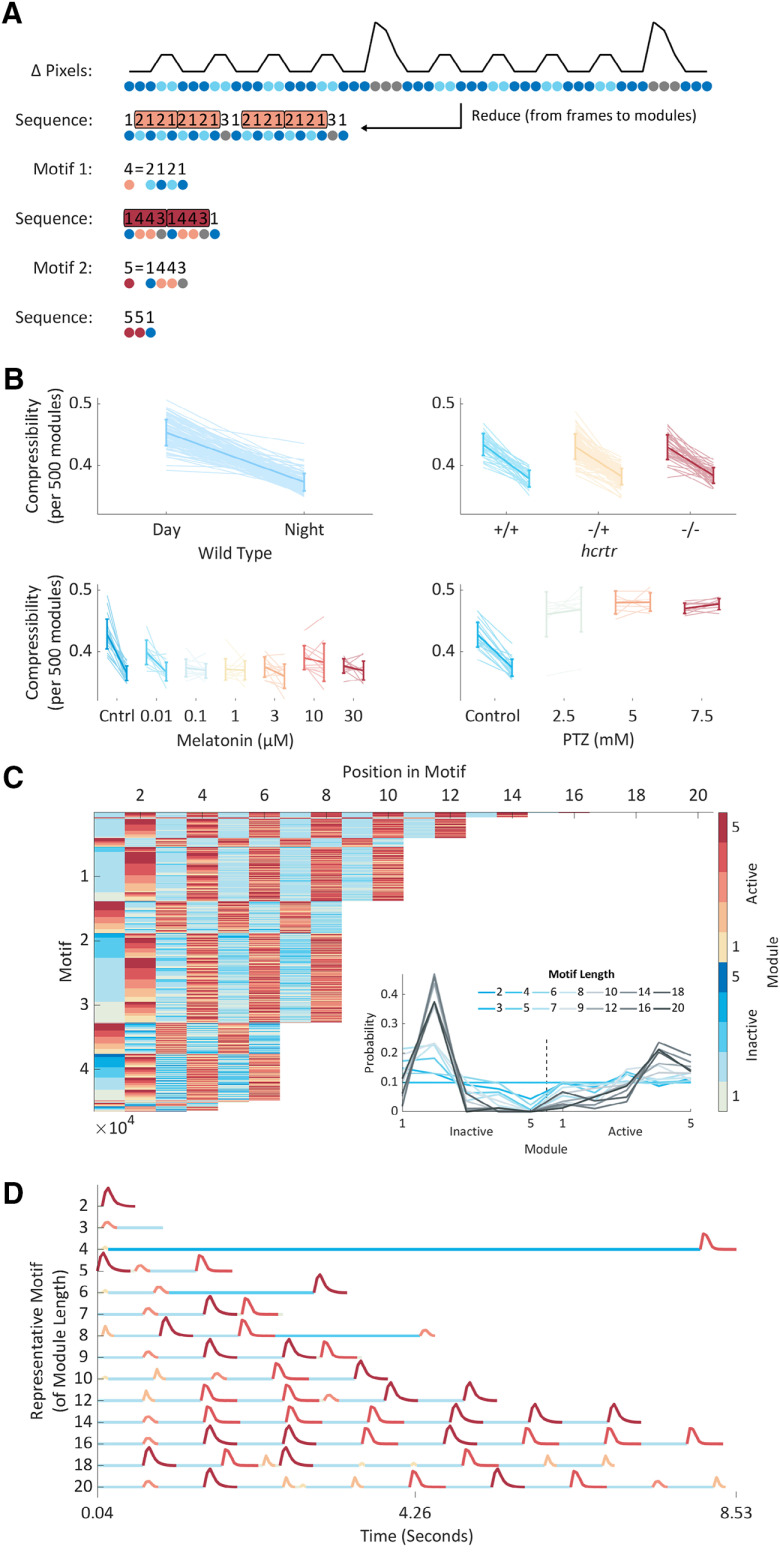
Hierarchical compression reveals structure in zebrafish behavior. A, Compression explained using fictive data. Top to bottom, From Δ pixels data (black trace), we classified both active and inactive behaviors into modules (colored circles). From modular behavioral sequences, we identified motifs (sequences of modules) using a compression algorithm. Compression iteratively identifies motifs (shown as boxes) by replacing them with new symbols until no more motifs can be identified and the sequence is maximally compressed. B, Each panel shows how compressibility, calculated from 500 module blocks, varies in different behavioral contexts. Each pale line shows an individual fish’s mean compressibility during the day and the night. The darker overlay shows a population day and night mean ± SD. In the wild-type data, compressibility is higher during the day than the night (p < 10−158) and increases from day/night 5–6 (p < 10−4), findings consistent across triplicate experiments. Melatonin decreases (p < 10−10), while PTZ increases compressibility (p < 10−8). There is no effect of hcrtr genotype on compressibility. Statistics are two-way or four-way ANOVA. C, All 46,554 unique motifs (y-axis) identified by compressing data from all animals. Each motif’s module sequence is shown, with the modules colored according to the colormap on the right. Motifs are sorted by length and then sequentially by module. Motifs range in length from 2 to 20 modules long. Inset, For each motif length, the probability of observing each inactive or active module. D, Each motif in the library consists of an alternating sequence of Δ pixels changes and pauses (active and inactive modules). A representative motif of each module length is shown with each module colored according to the colormap in C. Representative motifs were chosen by determining every motif’s distribution of modules and then for each observed module length, selecting the motif closest to the average module distribution (see C, inset). Extended Data Figure 3-1 supports Figure 3.

Acknowledgments
This image is the copyrighted work of the attributed author or publisher, and ZFIN has permission only to display this image to its users. Additional permissions should be obtained from the applicable author or publisher of the image. Full text @ eNeuro