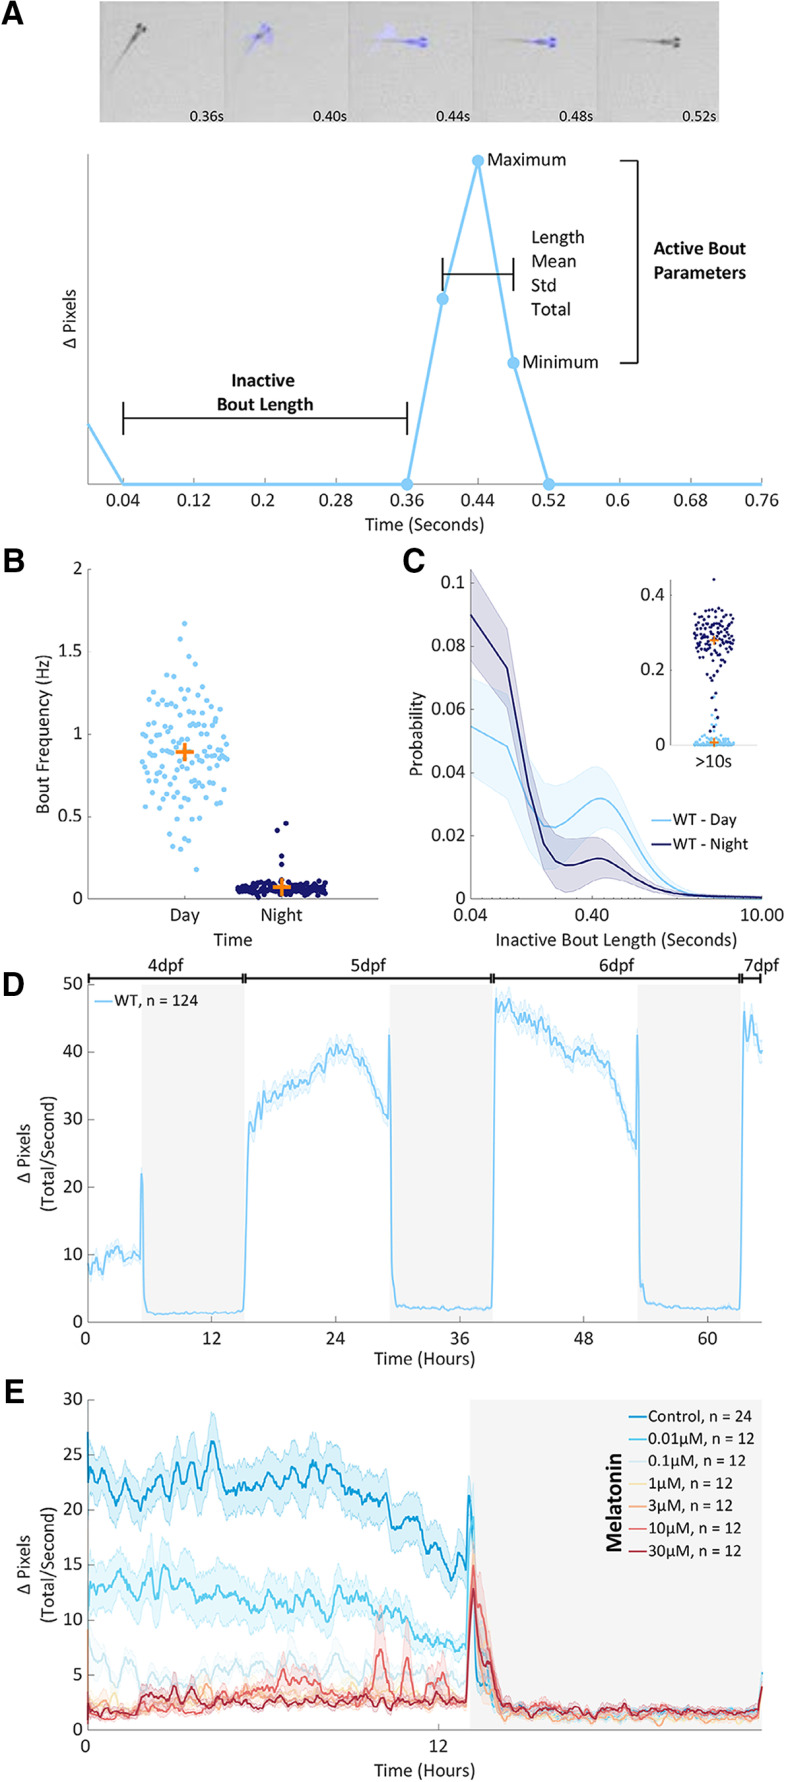
IMAGE

Figure 1.

ID
ZDB-IMAGE-200807-1
Source
Figures for Ghosh et al., 2020
Image
Figure Caption

Figure 1.

Behavior at scale. A, top panel, Five consecutive frames from an individual well of a 96-well plate as a 6 dpf zebrafish larva performs a swim bout. Blue highlights pixels that change intensity between frames (Δ pixels). Lower panel. A Δ pixels time series from the larva above. Highlighted are the features that describe each active and inactive bout. B, Mean bout frequency (Hz) recorded from individual larvae at 5 and 6 dpf during the day (light blue) and the night (dark blue). Each dot is 1 of 124 wild-type larvae. The orange crosses mark the population means. C, The probability of observing different lengths of inactivity during the day (light blue) or the night (dark blue) at 5 and 6 dpf. Each larva’s data were fit by a pdf. Shown is a mean pdf (bold line) and SD (shaded surround) with a log scale on the x-axis cropped to 10 s. Inset, The total probability of inactive bout lengths longer than 10 s, per animal. D, The mean activity of 124 wild-type larvae from 4 to 7 dpf, on a 14/10 h light/dark cycle. Data for each larva was summed into seconds and then smoothed with a 15-min running average. Shown is a summed and smoothed mean Δ pixels trace (bold line) and SEM (shaded surround). E, Average activity across one day (white background) and night (dark background) for larvae dosed with either DMSO (control) or a range of melatonin doses immediately before tracking at 6 dpf. Data were summed and smoothed as in D. The number of animals per condition is denoted as n. Extended Data Figures 1-1, 1-2, 1-3 support Figure 1.

Acknowledgments
This image is the copyrighted work of the attributed author or publisher, and ZFIN has permission only to display this image to its users. Additional permissions should be obtained from the applicable author or publisher of the image. Full text @ eNeuro