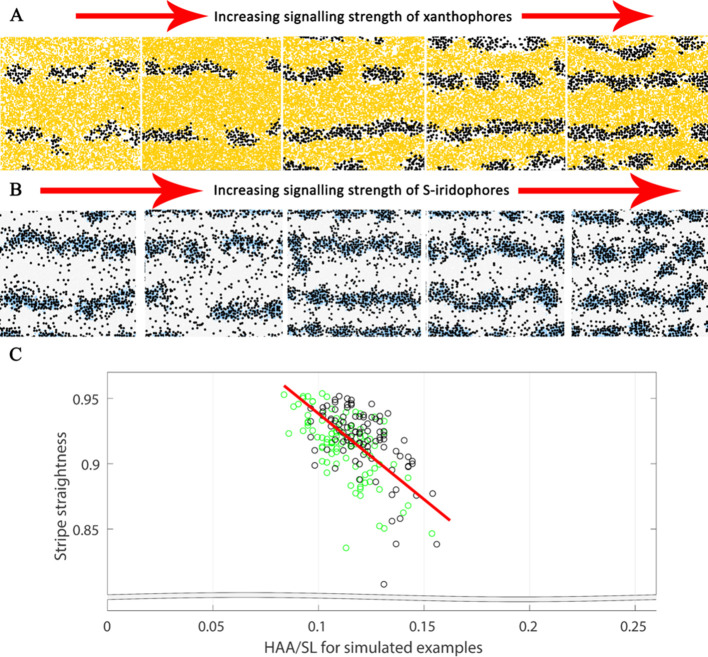
IMAGE

Figure 14.

ID
ZDB-IMAGE-200731-30
Source
Figures for Owen et al., 2020
Image
Figure Caption

Figure 14. Substantial alterations in starting conditions generate major alterations in pattern formation.

The effects of different signalling strengths in pfe and shd. Representative images of J+ simulations of (A) shd and (B) pfe where the signalling strength of melanocyte differentiation in the long range is increased (from left to right). Increasing the signalling strength of the respective cell types decreases the width of the interstripe X0 and increases the number of pseudo-stripes from 2 to 4. For our simulations, we choose the weakest shown signalling strength for xanthophores, corresponding to the furthest left of (A) and the strongest shown signalling strength for S-iridophores, corresponding to the furthest right of (B). (C) Stripe straightness of our simulations correlates with the simulated HAA/SL ratio. Each circle is one simulation, green circles indicate simulations up to stage J, black circles indicate simulations of up to stage J+. There are one hundred simulations in total for each stage. The red line is the line of best fit.

Acknowledgments
This image is the copyrighted work of the attributed author or publisher, and ZFIN has permission only to display this image to its users. Additional permissions should be obtained from the applicable author or publisher of the image. Full text @ Elife