IMAGE

Figure 11

ID
ZDB-IMAGE-200716-64
Source
Figures for Keller et al., 2020
Image
Figure Caption

Figure 11

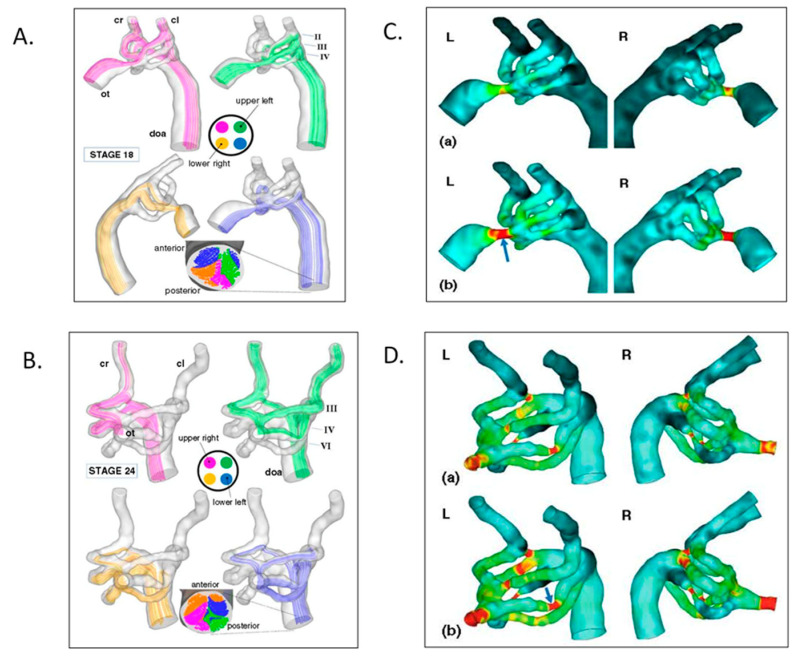
Aortic arch morphogenesis and flow modeling. (A) Representative mean flow path-lines using realistic geometries from micro-CT casts, fluorescent ink injections in a stage 18 chick embryo. Note that flow stream separation occurs through the aortic sac, arches, and dorsal aorta. (B) Representative mean flow path-lines using realistic geometries from micro-CT casts, fluorescent ink injections in a stage 24 chick embryo with similar flow stream separation. (C) Aortic sac and arch wall shear stress distributions at stage 18 for the left lateral (L) and right lateral (R) views. (D) Aortic sac and arch wall shear stress distributions at stage 24. This was adapted with permission [161].

Acknowledgments
This image is the copyrighted work of the attributed author or publisher, and ZFIN has permission only to display this image to its users. Additional permissions should be obtained from the applicable author or publisher of the image. Full text @ J Cardiovasc Dev Dis