
Image
|
Figure Caption
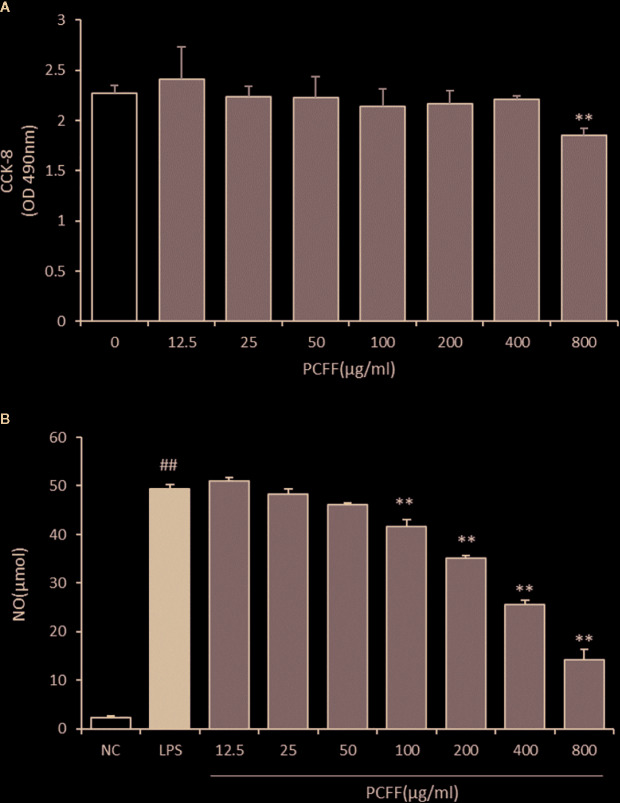
Figure 5
Cytotoxicity of PCFF on RAW264.7 cells and effects of PCFF on LPS-induced NO production in RAW264.7 cells.
Acknowledgments
This image is the copyrighted work of the attributed author or publisher, and
ZFIN has permission only to display this image to its users.
Additional permissions should be obtained from the applicable author or publisher of the image.
Full text @ Front Pharmacol