IMAGE

Figure 3.

ID
ZDB-IMAGE-200622-23
Source
Figures for Müller et al., 2020
Image
Figure Caption

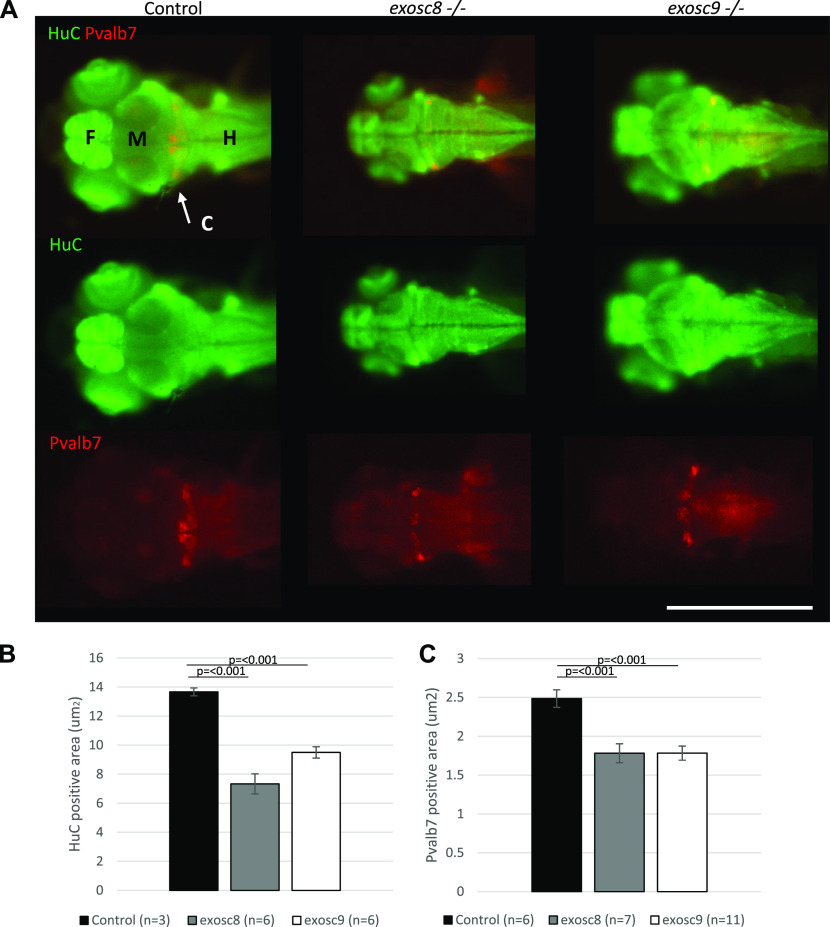
Figure 3. <italic>exosc8</italic> and <italic>exosc9</italic> homozygous mutant zebrafish develop cerebellar atrophy.

(A) Immunofluorescence in 5-dpf wild-type, exosc8 homozygous mutant and exosc9 homozygous mutant zebrafish embryos with antibodies raised against HuC (green) and Pvalb7 (red) Pvalb7 is a marker for Purkinje cells in the cerebellum, HuC is an early neuronal marker. Scale bar: 500 μm. (B, C) Quantification of (B) HuC-positive area and (C) Pvalb7-positive area in 5-dpf wild-type, exosc8 homozygous mutant and exosc9 homozygous mutant zebrafish embryos. Three control, six exosc8 (c.26_27del), and six exosc9 (c.198_208del) homozygous larvae were measured for the HuC quantification. 6 control, 7 exosc8 (c.26_27del), and 11 exosc9 (c.198_208del) homozygous larvae were measured for the Pvalb7 quantification. Error bars represent the standard error (±SEM) and statistical analysis was performed using unpaired t tests (exosc8 versus wt and exosc9 versus wt, respectively). Labelling: C, cerebellum; F, forebrain; H, hindbrain and spinal cord; M, midbrain.

Figure Data
Acknowledgments
This image is the copyrighted work of the attributed author or publisher, and ZFIN has permission only to display this image to its users. Additional permissions should be obtained from the applicable author or publisher of the image. Full text @ Life Sci Alliance