
Figure 3
- ID
- ZDB-IMAGE-200520-4
- Publication
- Wierson et al., 2020 - Efficient targeted integration directed by short homology in zebrafish and mammalian cells
- All Figures
- Figures for Wierson et al., 2020
|
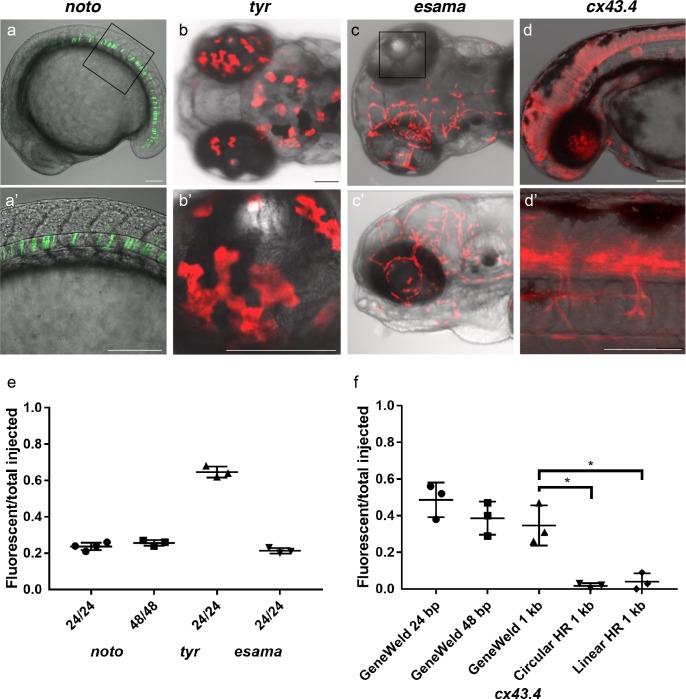
Figure 3 (a–d) Live confocal images of F0 injected embryos showing fluorescent reporter expression after GeneWeld targeted integration. (a, a’) Mid somite stage embryo targeted at noto with 2A-eGFP. (b, b’) 5 days post fertilization (dpf) Tg(UAS:mRFP)tpl2 embryo targeted at tyr with 2A-Gal4/VP16. (c) 2 dpf and (c’) 3dpf Tg(UAS:mRFP)tpl2 embryo targeted at esama with −2A-Gal4/VP16. (d, d’) 31 hr post fertilization embryo targeted at cx43.4 with 2A-tagRFP-CAAX. (e) Fraction of embryos with reporter gene expression following GeneWeld targeting at noto, tyr and esama. 5’ and 3’ homology lengths flanking donor cargos indicated in base pairs as 24/24 or 48/48. (f) Comparison of the fraction of RFP expressing embryos after targeting cx43.4 exon 2 using GeneWeld 24/24 bp homology, GeneWeld 48/48 bp homology, Geneweld 1 kb/1 kb homology, Circular HR 1 kb/1 kb (injection did not include UgRNA, *p=0.0067), Linear HR 1 kb/1 kb (donor was digested and the linear DNA fragment containing the homology arm targeting construct was gel purified before injection, *p=0.0111). Data represents mean +/- s.e.m. of 3 independent targeting experiments. p values calculated using Students t test. Scale bars, 100 μm.