
|
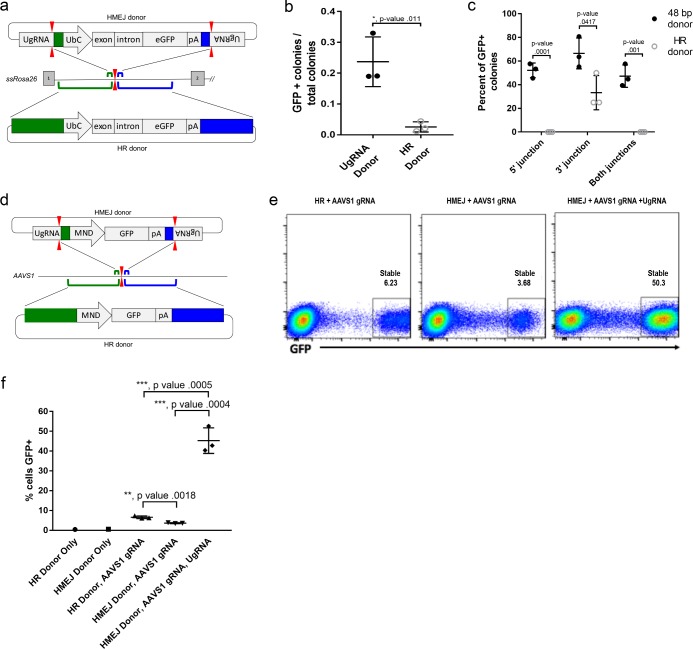
Figure 6 (a) Strategy for integration using HMEJ and HR donors into intron 1 of S. scrofa ROSA26 locus. Arrowheads CRISPR/Cas9 (for HMEJ donor) and TALEN (genome) DSBs. (b) Targeting efficiency of the HMEJ donor vs the HR donor as reported by GFP positive colonies out of total colonies. (c) Percent of GFP positive colonies analyzed containing properly sized junction fragments, comparing HMEJ and HR donors. Data are from three independently targeted cell populations. Data represents mean +/- s.e.m. of 3 independent targeting experiments. (d) Diagram of HR and HMEJ strategies for targeted integration of a MND:GFP reporter cassette into the human AAVS1 locus. (e) Flow cytometry analysis of GFP expression 14 days post-electroporation for each targeting modality: HR (left), HMEJ without universal sgRNA (middle), and HMEJ with universal sgRNA (right). Stable gate was drawn to measure the uniformly expressing population formed by targeted integration and was set based on episome only controls. (f) Quantification of stable GFP expressing population as measured by flow cytometry at day 14. Data are from three independently targeted cell populations. Data represents mean +/- s.e.m. of 3 independent targeting experiments. p values calculated using two-tailed unpaired t-test.