
Fig. 3
- ID
- ZDB-IMAGE-200514-37
- Publication
- Weber et al., 2020 - Zebrafish disease model of human RNASET2 deficient cystic leukoencephalopathy displays abnormalities in early microglia
- All Figures
- Figures for Weber et al., 2020
|
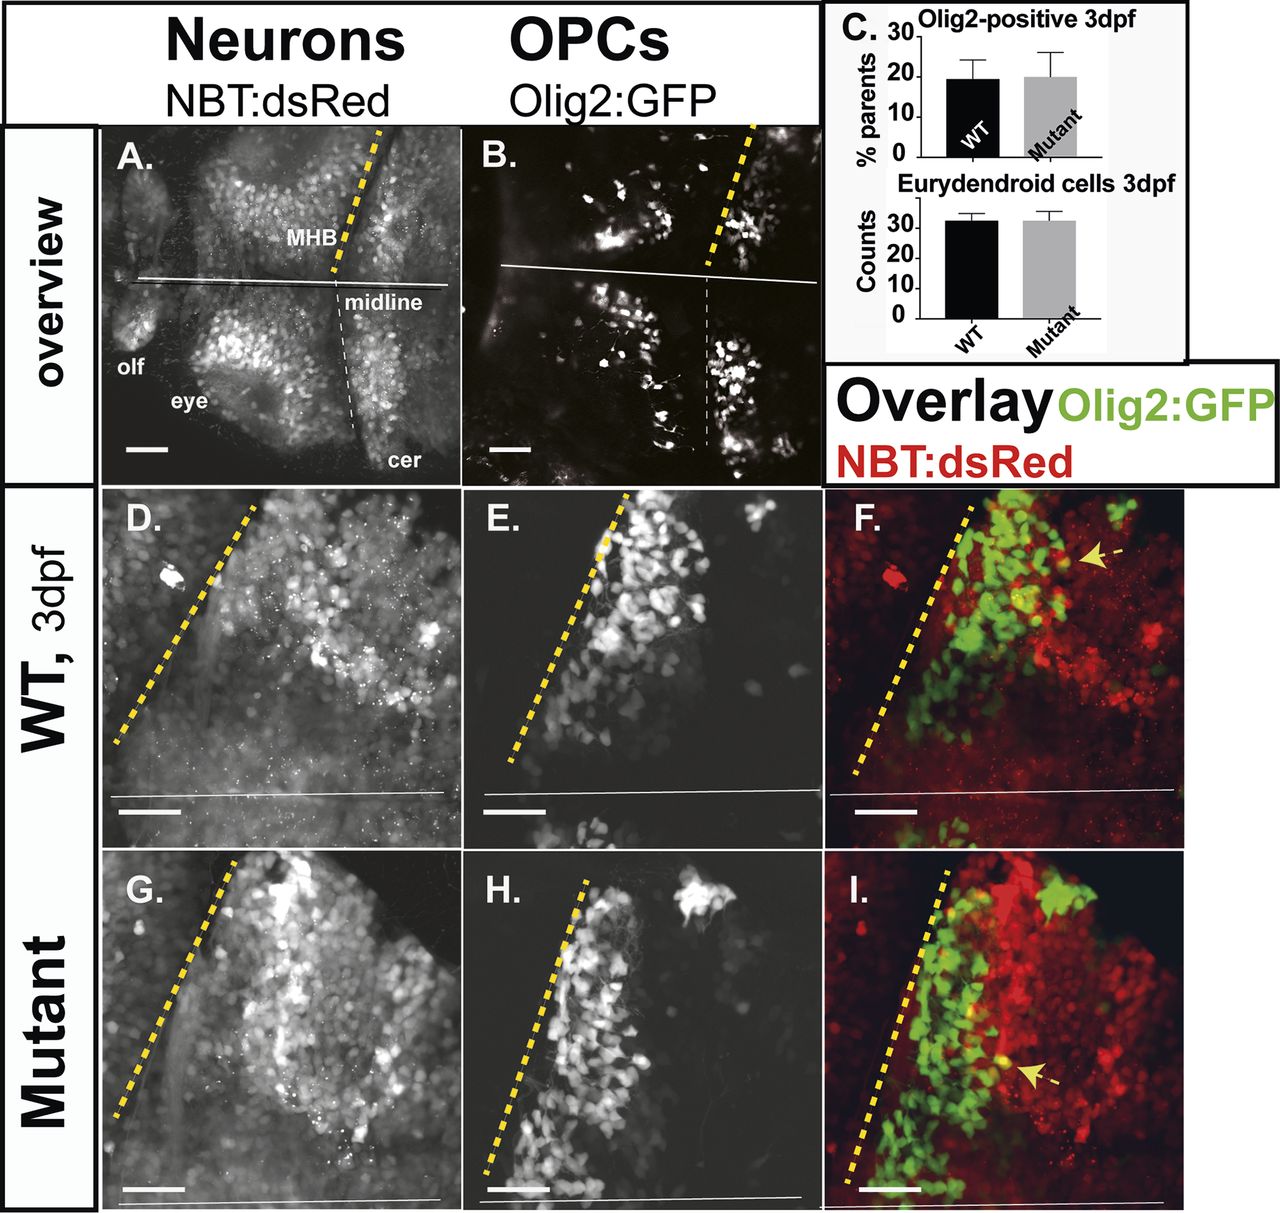
Fig. 3
Neurons and oligodendrocytes in the developing hindbrain. Zebrafish larvae of compound transgenics Tg:(NBT:dsRed)/Tg:(Olig2:GFP) analyzed by in vivo CLSM. Projections of confocal z-stacks highlight neurons and OPCs at 3 dpf. (A,B) Overview; brain of a WT larvae, showing neurons (NBT:dsRed) and OPCs (Olig2:GFP). (C) Relative proportions of OPCs (average OPCs: WT 19.53%; n=7; mutants 20.8%; n=4; P>0.5) and counts of developing eurydendroid cells (average ECs: mutants 32.6; n=3; WT 32.6; n=3; P>0.5) in the right cerebellar hemispheres. Expression of both fluorophores in F and I is indicated by yellow arrows. Projections of representative confocal z-stacks through the cerebellum on 3 dpf (D,E,G,H). Scale bars: 40 µm. n-numbers were generated from one litter and analyzed in one CLSM-session.