
Fig. 2
- ID
- ZDB-IMAGE-200514-36
- Publication
- Weber et al., 2020 - Zebrafish disease model of human RNASET2 deficient cystic leukoencephalopathy displays abnormalities in early microglia
- All Figures
- Figures for Weber et al., 2020
|
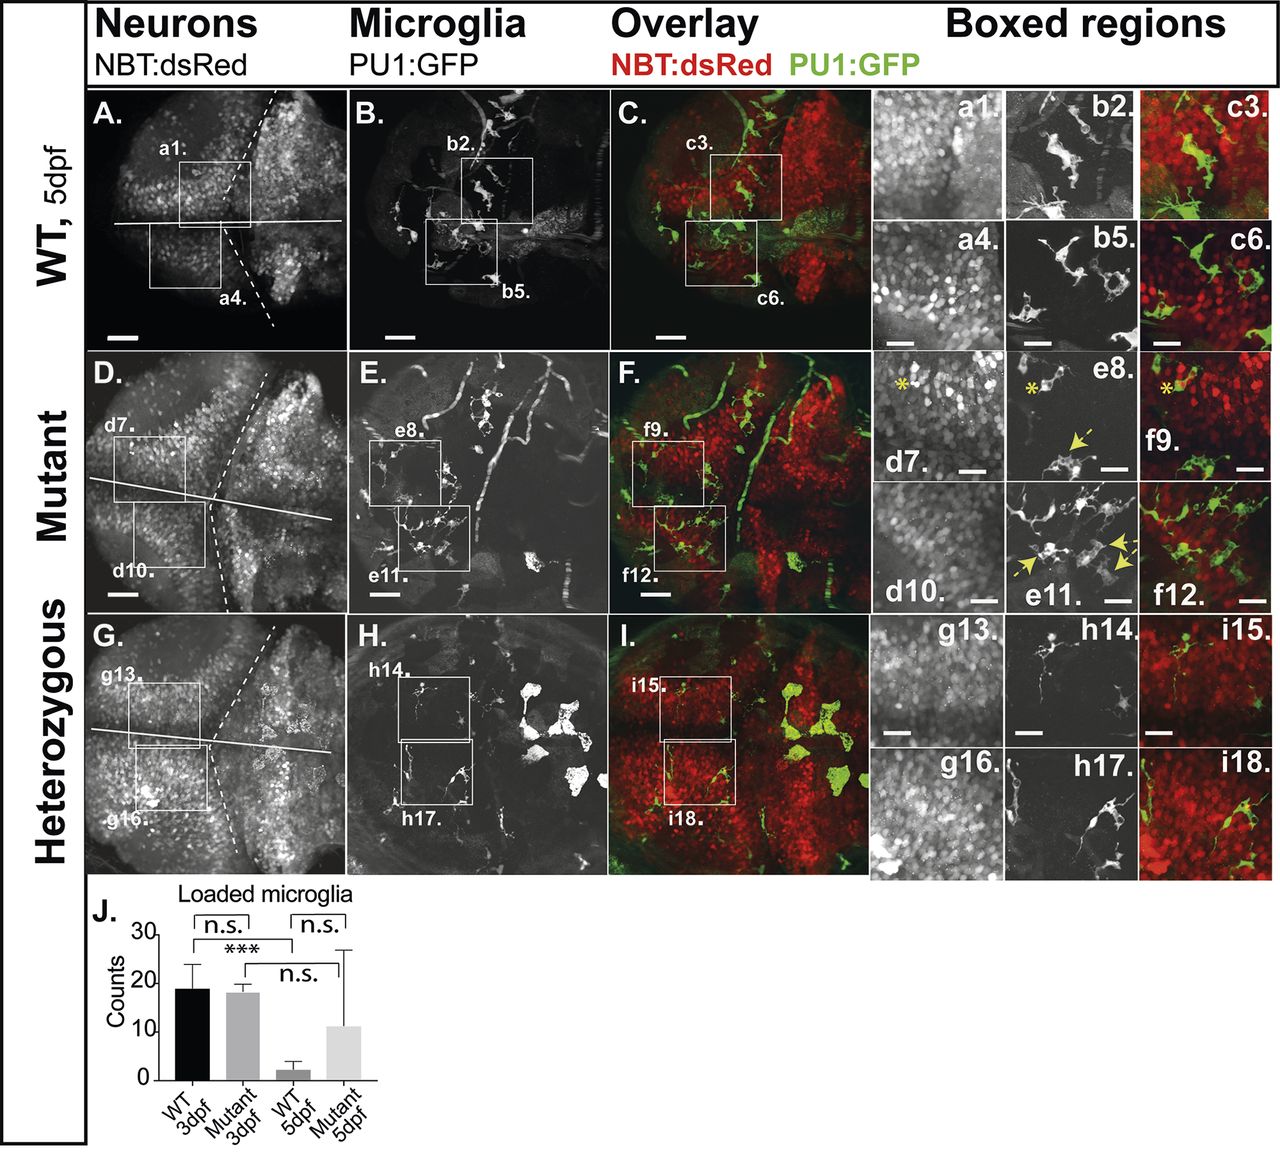
Fig. 2
Engulfment of apoptotic neurons. Compound transgenic reporter strain zebrafish embryos Tg:(PU1:GFP)/Tg:(NBT:dsRed) were analyzed by in vivo CLSM at 5 dpf. Representative projections of confocal z-stacks through the brain: (A,D,G) NBT:dsRed (neurons); (B,E,H) PU1:GFP (microglia). (C,F,I) Overlays of the respective panels (A,B and C,D). Boxed regions, increased images: (a,d,g) neurons; (b,e,h) microglia; (c,f,i) microglia with engulfed apoptotic bodies of neurons (loaded microglia, asterisks; vacuoled microglia, arrows). (J) Quantification of loaded microglia (3 dpf, see Fig. S3: WT 19.0; n=5; mutants 18.3; n=3; P>0.5; 5 dpf: WT 2.3: s.d.=1.8; n=6; mutants 11.3; s.d.=15.6; n=7; P>0.5). Scale bars: 40 µm. E,F show expression of GFP in circulating cells as observed in about 20% of PU1:GFP-positive larvae. n-numbers were generated from one to three individual litters and analyzed in one to three independent CLSM-sessions.