
|
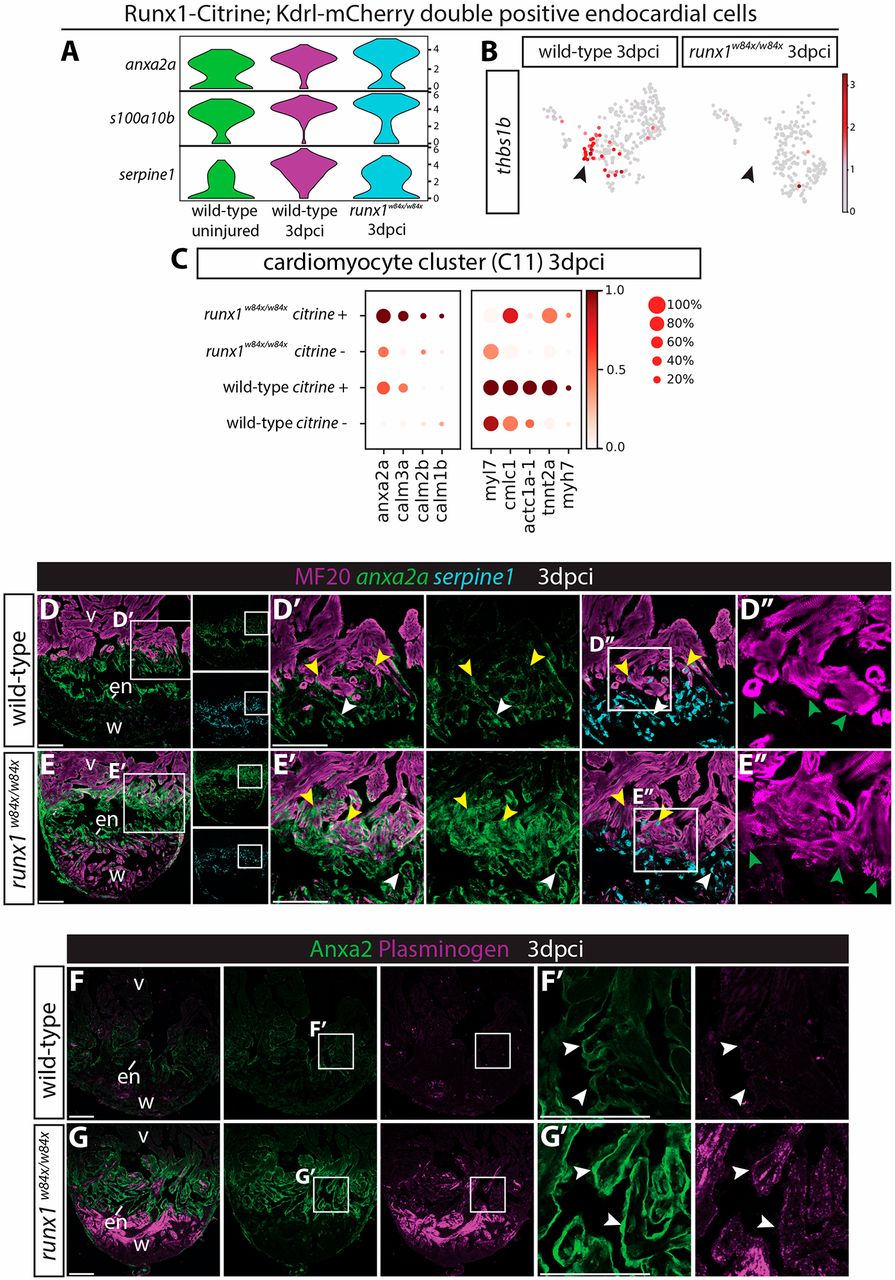
Fig. 10 Runx1 mutant hearts upregulate Anxa2 and plasminogen. (A) Violin plots showing upregulation of anx2a and s100a10b in wild-type runx1/citrine;mcherry/kdrl double-positive cells after injury, with even higher expression in the runx1 mutant. In contrast, serpine1 is downregulated in the mutant cells. (B) UMAP plot of the runx1/citrine;mcherry/kdrl double-positive cells showing thbs1b-expressing cells. Arrowheads indicate thbs1b expression mainly in cluster 4 from Fig. 6A, which is missing in the runx1 mutant after injury. (C) Dotplot showing that anxa2a, calm1b, calm2b and calm3a are upregulated in the mutant citrine-positive myocardium at 3 dpci, whereas sarcomere genes are upregulated in the wild-type citrine-positive myocardium. (D-E′) Section in situ hybridisation for anxa2a and serpine1 with immunohistochemistry for MF20 shows that anxa2a has a similar expression pattern to Runx1-Citrine after injury in the wild type, but is expressed at much higher levels in the mutant endocardium (white arrowheads) and myocardium (yellow arrowheads). serpine1 expression is found in both the wound border endocardium (white arrowheads) and myocardium (yellow arrowheads). (D″,E″) Sarcomere structure differs between the wild-type and the mutant in the wound border (green arrowheads). (F-G′) Immunohistochemistry for plasminogen and Anxa2 shows upregulation of plasminogen in the area where Anxa2 is upregulated (arrowheads) in the mutant. en, endocardium; v, ventricle; w, wound. Scale bars: 100 μm.