
Fig. 2.
- ID
- ZDB-IMAGE-200509-36
- Publication
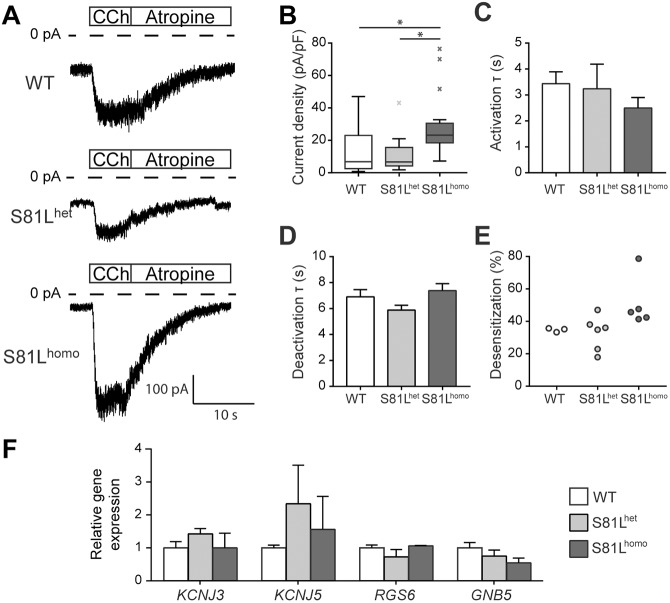
- Veerman et al., 2019 - Genetic variation in GNB5 causes bradycardia by augmenting the cholinergic response via increased acetylcholine-activated potassium current (IK,ACh)
- All Figures
- Figures for Veerman et al., 2019
|
Fig. 2.