
Figure 2
- ID
- ZDB-IMAGE-200423-51
- Genes
- Publication
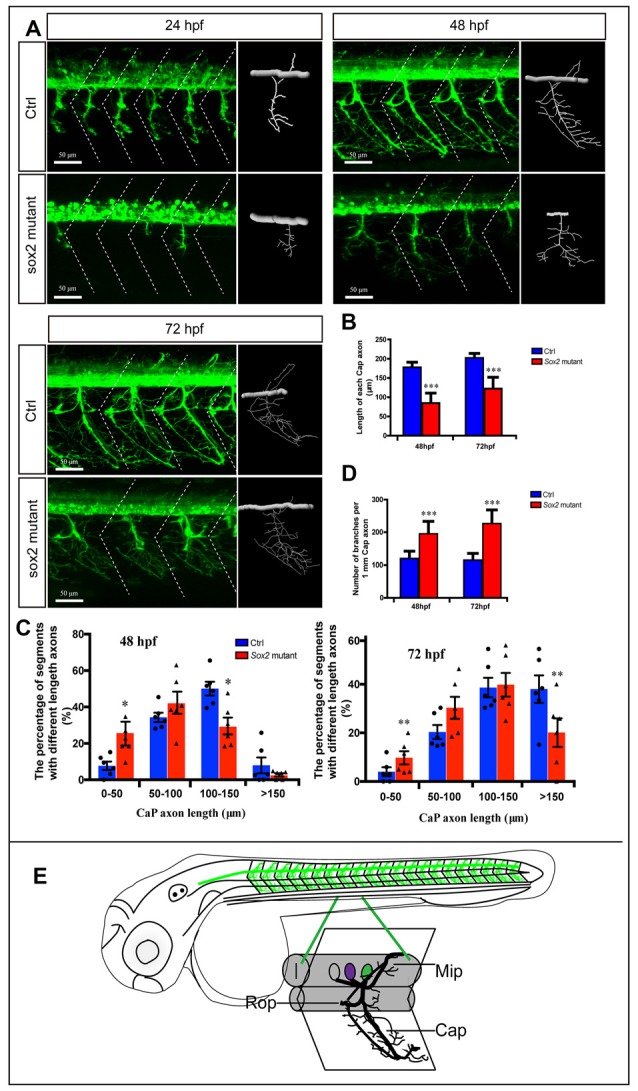
- Gong et al., 2020 - The Requirement of Sox2 for the Spinal Cord Motor Neuron Development of Zebrafish
- All Figures
- Figures for Gong et al., 2020
|
Figure 2
Primary motor neuron morphogenesis defects in the Sox2 knockout zebrafish.