
|
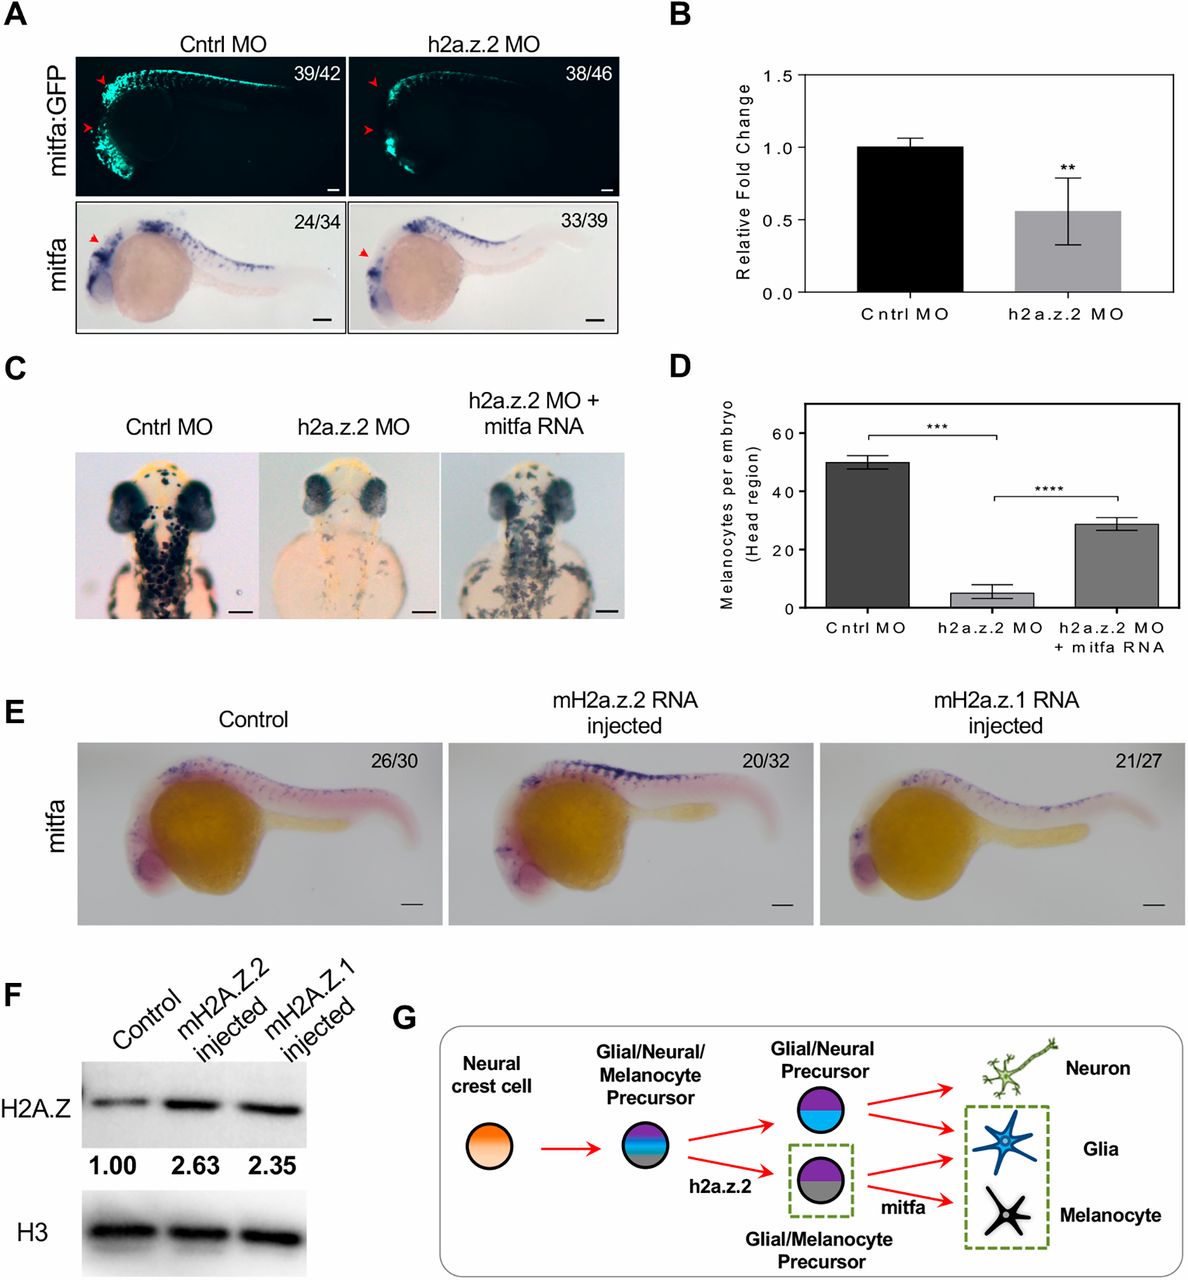
Fig. 3 H2a.z.2 genetically interacts with mitf during melanocyte specification. (A) Top: Tg(mitfa:GFP) labelling of melanocytes. Red arrowheads indicate cranial and vagal melanocytes. Bottom: WISH of mitfa at 24 hpf. Red arrowheads indicate cranial melanocytes. (B) Real-time quantification of mitfa RNA upon Z2 MO indicates a ∼0.5-log2 fold downregulation in expression. Bars represent mean±s.e.m. across three independent biological replicates with ∼50 embryos each. (C) Bright-field images of control, Z2 MO and Z2 MO, co-injected with mitfa mRNA at 48 hpf, showing head melanophores. (D) Quantification of the rescue of head melanophore numbers upon mitfa RNA co-injection. Bars represent geometric mean with 95% CI of the number of head melanophores with at least 30 embryos each. (E) mitfa WISH at 24 hpf upon RNA injection of mouse H2a.z.2 or H2a.z.1, compared with the noninjected control. (F) Western blot analysis of H2AZ protein in noninjected or mouse H2a.z.2 or H2a.z.1 RNA-injected embryos, normalized to total H3 protein. (G) Schematic representation of the neural crest-derived lineages, highlighting the dependence of melanocyte and glial cells on h2a.z.2. The numbers in the WISH images indicate frequency of the represented phenotype in the total number of embryos analysed. Scale bars: 100 μm.