
Image
|
Figure Caption
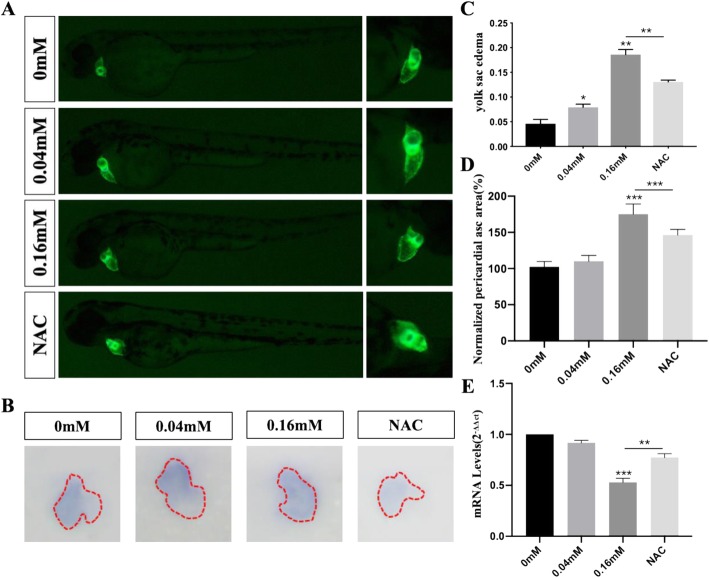
Fig. 2
The alteration in the cardiac morphology at 48hpf by using transgenic strain zebrafish (Cmlc2-GFP) The red lines represented the outline of the heart (
Figure Data
Acknowledgments
This image is the copyrighted work of the attributed author or publisher, and
ZFIN has permission only to display this image to its users.
Additional permissions should be obtained from the applicable author or publisher of the image.
Full text @ BMC Pharmacol Toxicol