IMAGE

Figure 3

ID
ZDB-IMAGE-200325-147
Source
Figures for Lee et al., 2020
Image
Figure Caption

Figure 3

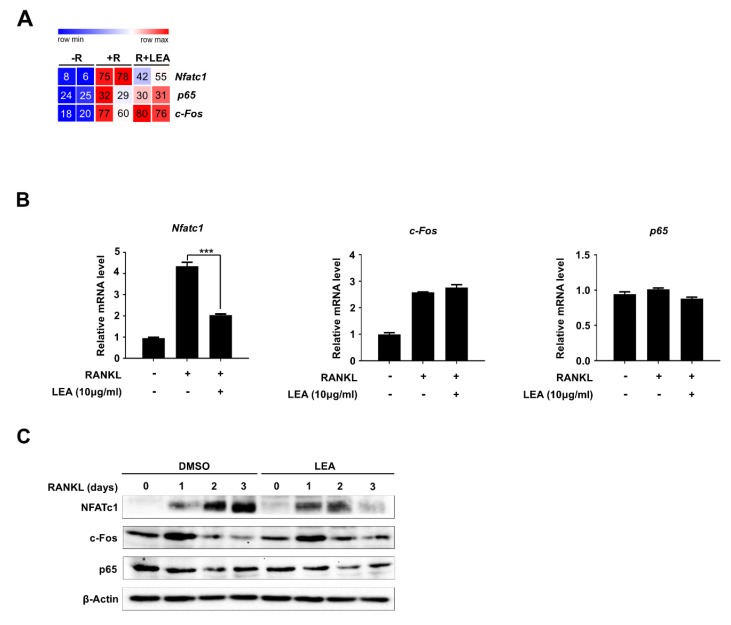
LEA represses RANKL-mediated NFATc1 expression. (A) Heatmap showing the reads per kilobase per million (RPKM) of c-Fos, NF-κB and NFATc1. Numbers within the figure indicate RPKM values. (B) Total RNA was prepared after treated with M-CSF (30 ng/mL) and RANKL (100 ng/mL) in the presence or absence of LEA (10 μg/mL), and qRT-PCR was performed using primers specific for Nfatc1, c-Fos, and p65. Results represents the means ± SD of three independent experiments. *** p < 0.001 versus only RANKL treatment. (C) Whole cell lysates were prepared from M-CSF/RANKL-treated BMMs with or without LEA (10 μg/mL) for 0, 1, 2, and 3 days, and analyzed by immunoblotting with NFATc1, c-Fos and p65 antibodies. β-Actin was probed as a loading control.

Acknowledgments
This image is the copyrighted work of the attributed author or publisher, and ZFIN has permission only to display this image to its users. Additional permissions should be obtained from the applicable author or publisher of the image. Full text @ Int. J. Mol. Sci.