
|
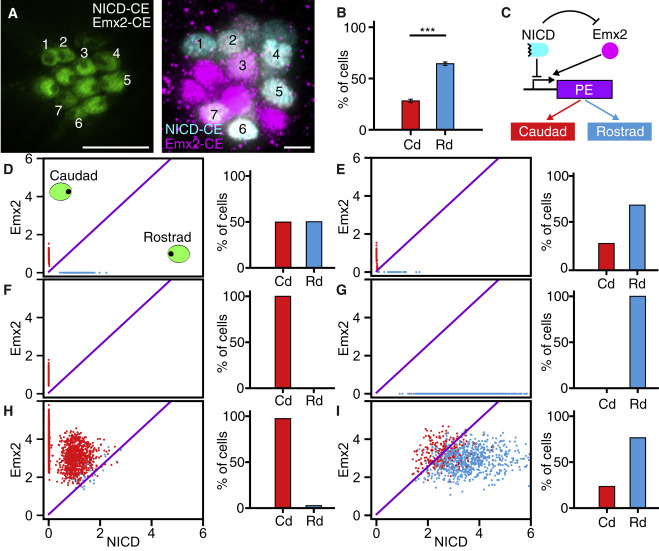
Fig. 5 Modeling of the Regulatory Network Underlying Hair-Cell Polarity (A) In an apical view, numerals mark the hair cells in a larva constitutively expressing both NICD (cyan) and Emx2 (magenta). (B) In larvae expressing both proteins, 334 hair cells from 50 neuromasts display a strong bias toward rostrad polarity. (C) In the proposed regulatory network, Notch and Emx2 control hair-cell polarity through a downstream polarity effector (PE), which might be a single protein or a more complex system. (D–I) The panels display the steady-state expression of Emx2 and NICD for multiple simulations of hair-cell pairs of (D) wild-type, (E) DAPT-treated, (F) Notch1a−/−, (G) NICD-CE, (H) Emx2-CE, and (I) NICD-CE/Emx2-CE neuromasts. In each panel, the oblique purple line demarcates the threshold for switching of the polarity effector. Scale bars, 5 μm. Means ± SEM; ∗∗∗p < 0.001. See also Figure S5 and Video S5.