
Image
|
Figure Caption
Figure 7
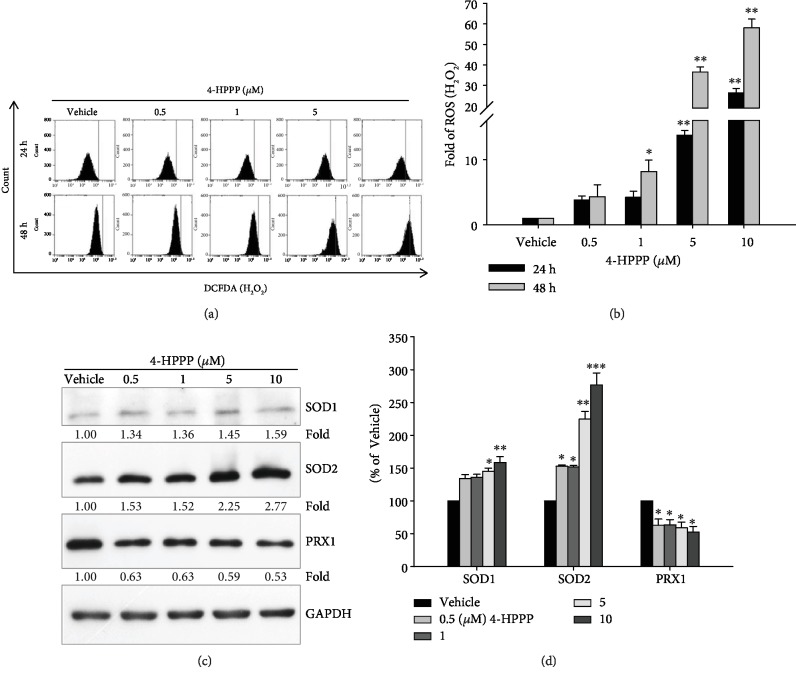
4-HPPP-induced changes in endogenous ROS and antioxidants in NSCLC cells. (a) H1299 cells were treated with the indicated concentrations of 4-HPPP for 24 h and 48 h. Afterward, intracellular levels of ROS were measured by the flow cytometry-based DCF-DA assay described in Materials and Methods. (b) Quantitative analysis of (a). (c) Changes in endogenous antioxidants SOD1, SOD2, and PRX1 in H1299 cells following 4-HPPP treatment by Western blotting. (d) Quantitative analysis of (c). ∗
Acknowledgments
This image is the copyrighted work of the attributed author or publisher, and
ZFIN has permission only to display this image to its users.
Additional permissions should be obtained from the applicable author or publisher of the image.
Full text @ Oxid Med Cell Longev