
IMAGE
Figure 7
Image
|
Figure Caption
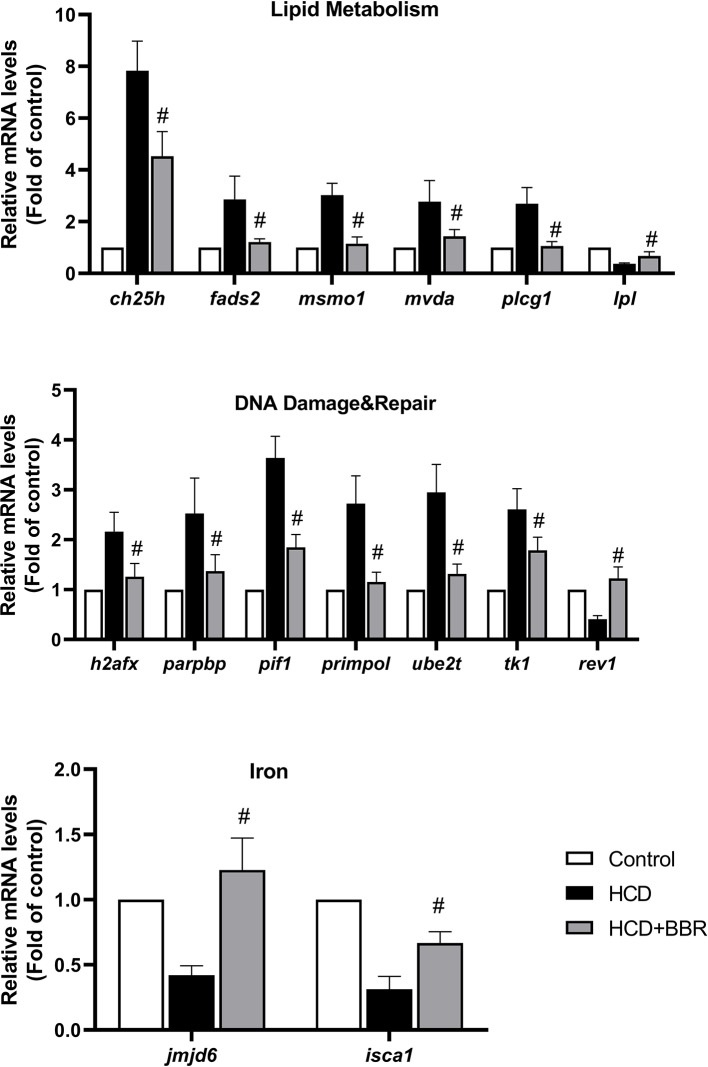
Figure 7
Validation of the microarray data using quantitative real-time PCR (qRT-PCR). Relative expression levels of the selected genes determined using qRT-PCR. #Compared with the HCD group,
Figure Data
Acknowledgments
This image is the copyrighted work of the attributed author or publisher, and
ZFIN has permission only to display this image to its users.
Additional permissions should be obtained from the applicable author or publisher of the image.
Full text @ Front Pharmacol