
Image
|
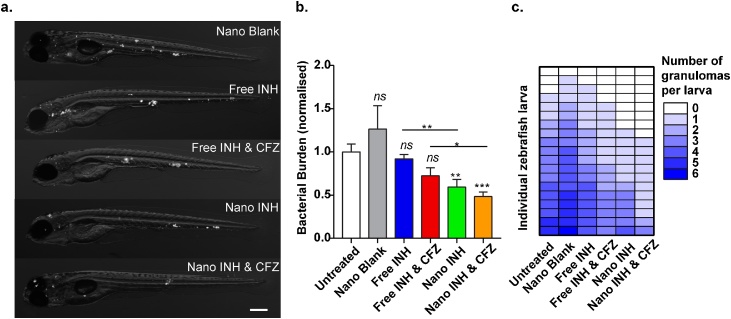
Figure Caption
Fig. 6
Effect of nanobiotics at 3 days post infection on zebrafish infected with fluorescently-labelled
Acknowledgments
This image is the copyrighted work of the attributed author or publisher, and
ZFIN has permission only to display this image to its users.
Additional permissions should be obtained from the applicable author or publisher of the image.
Full text @ J. Control Release