IMAGE

Fig. 3

ID
ZDB-IMAGE-200124-56
Source
Figures for Batalha et al., 2019
Image
Figure Caption

Fig. 3

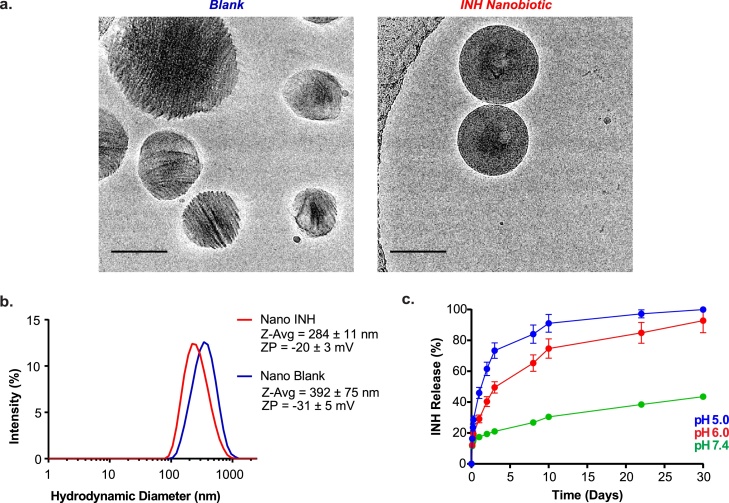
Characterization of polymeric nanobiotics a. Cryo-EM images show different shape and crystallinity of the Blank (left) and INH (right) nanobiotics (scale bar, 100 nm). b. Size distribution (nm) and zeta potential (mV) of Blank (blue) and INH (red) polymeric nanobiotics formulated by single emulsion solvent evaporation technique (n = 3). c. INH release from Nano INH at pH 5 (blue), 6 (red), and 7.4 (green), mimicking the acidic conditions of the phagolysosome and physiological conditions of systemic circulation (n = 3). (For interpretation of the references to colour in this figure legend, the reader is referred to the web version of this article).

Acknowledgments
This image is the copyrighted work of the attributed author or publisher, and ZFIN has permission only to display this image to its users. Additional permissions should be obtained from the applicable author or publisher of the image. Full text @ J. Control Release