IMAGE

Fig. 5

ID
ZDB-IMAGE-200102-19
Source
Figures for Brysch et al., 2019
Image
Figure Caption

Fig. 5

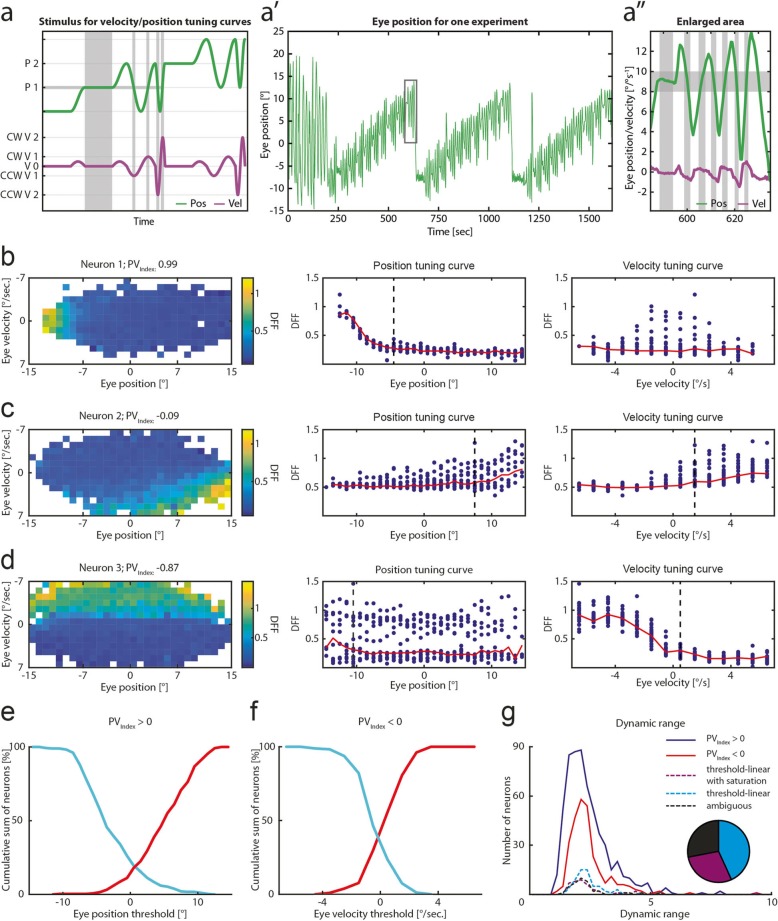
Neuronal tuning for eye velocity and position. a Schematic of the closed loop velocity/position stimulus for highlighted eye position (P1) at different slow-phase eye velocities (CCW V2, CCW V1, V0, CW V1, CW V2). Only two velocity steps are depicted for illustration purposes. Grey shaded rectangles show one eye position bin and different velocities for that bin. CCW, counter-clockwise; CW, clockwise; P, position; V, velocity. a′ Example binocular eye trace for one recording. a″ Highlighted area from a′. Grey boxes as in a. bd Left panel, tuning curves showing DFF colour coded for averaged eye position-velocity bins. Middle panel, position tuning curve. Red line shows averaged DFF between ± 1°/s eye velocity; blue dots for every other eye velocity bin (as in left panel). A black dashed line shows the firing threshold, if identified. Right panel, same as for the middle panel, but for eye velocity. Red line shows averaged DFF between ± 1° eye position. e Cumulative position threshold plot for position coding neurons (PVIndex > 0) pooled in ON direction to the right (red, n = 250) and left (cyan, n = 283). f Cumulative velocity threshold plot for velocity coding neurons (PVIndex < 0) pooled in ON direction to the right (red, n = 104) and left (cyan, n = 175). g Dynamic range of fluorescence for position and velocity coding neurons (PVIndex > 0, PVIndex < 0 respectively) and for neuron with a very strong velocity coding (PVIndex < − 0.5, dashed lines) separated by their response profile. Pie chart showing the relative numbers for strong velocity coding neurons (w/ saturation, 29% (40/139); w/o saturation, 43% (60/139); ambiguous, 28% (39/139))

Acknowledgments
This image is the copyrighted work of the attributed author or publisher, and ZFIN has permission only to display this image to its users. Additional permissions should be obtained from the applicable author or publisher of the image. Full text @ BMC Biol.