IMAGE

Fig. 6

ID
ZDB-IMAGE-200102-14
Source
Figures for Brysch et al., 2019
Image
Figure Caption

Fig. 6

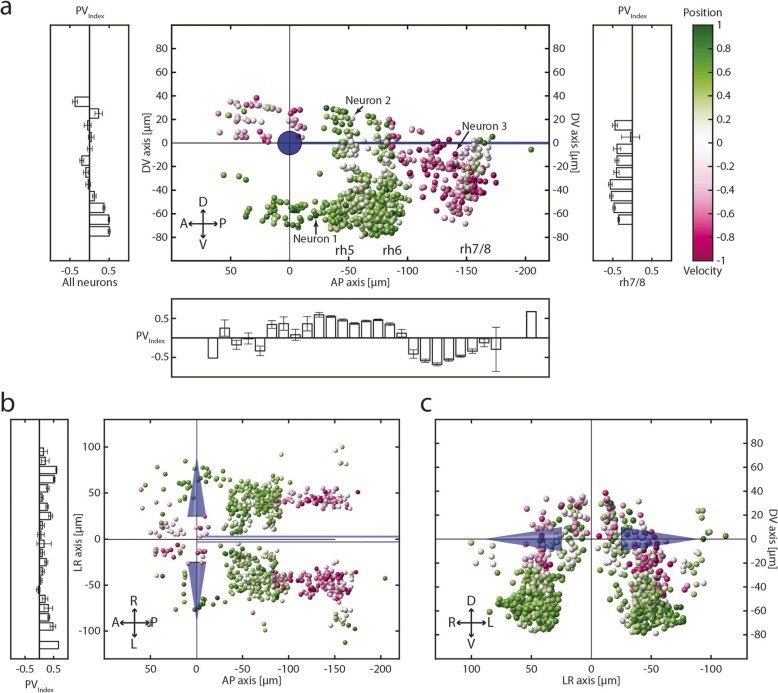
PVIndex distribution and spatial location of identified neurons. ac Sagittal (a), dorsal (b), and transversal (c) anatomical views of eye-correlated neurons colour-coded for the PVIndex which was calculated from the closed-loop experiment. Histograms show the anatomical distribution of neurons along the appropriate axis for either all neurons or exclusively for rh7/8. Blue cones, Mauthner cells; blue line, MLF; A, anterior; D, dorsal; L, left; P, posterior; R, right; V, ventral; error bars are SEM

Acknowledgments
This image is the copyrighted work of the attributed author or publisher, and ZFIN has permission only to display this image to its users. Additional permissions should be obtained from the applicable author or publisher of the image. Full text @ BMC Biol.