IMAGE

Fig. 5

ID
ZDB-IMAGE-200101-49
Genes
Source
Figures for Li et al., 2019
Image
Figure Caption

Fig. 5

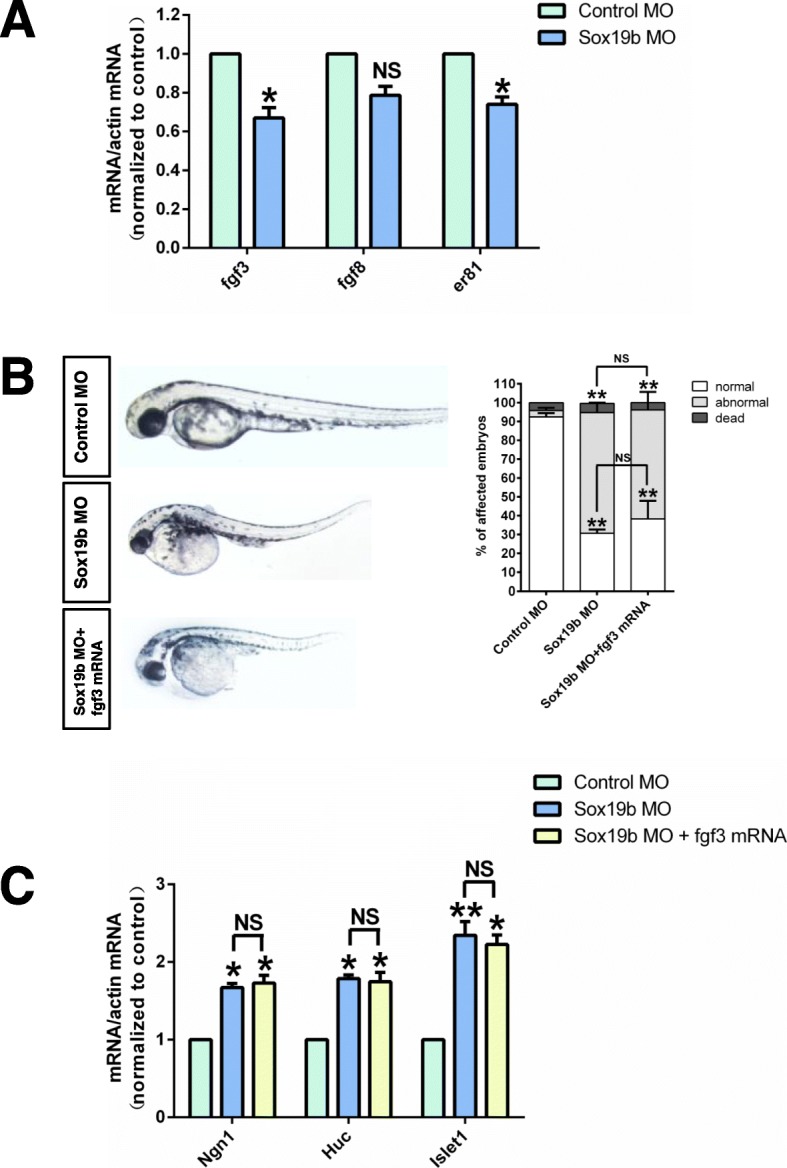
The FGF pathway did not play the most important role in the Sox19b regulation of NSCs. a Quantitative RT-PCR analysis is shown for fgf3, fgf8, and er81. Compared with the controls, the mRNA levels of fgf3 and er81 in Sox19b MO-injected embryos decreased significantly. Data represent the mean of at least three independent experiments ± SD. *P < 0.05 versus control. b Compared with embryos injected with Sox19b MO, the NTD appearance in zebrafish embryos was not rescued by the addition of fgf3 mRNA. c Quantitative RT-PCR analysis for Ngn1, Huc, and Islet1. Fgf3 mRNA could not change the increase in Ngn1, Huc, or lslet1 induced by Sox19b MO treatment. Data represent the mean of at least three independent experiments ± SD. *P < 0.05, **P < 0.01 versus control; ns, no significant difference

Figure Data
Acknowledgments
This image is the copyrighted work of the attributed author or publisher, and ZFIN has permission only to display this image to its users. Additional permissions should be obtained from the applicable author or publisher of the image. Full text @ Stem Cell Res. Ther.