IMAGE

Figure 2

ID
ZDB-IMAGE-191230-744
Source
Figures for Fitzgerald et al., 2019
Image
Figure Caption

Figure 2

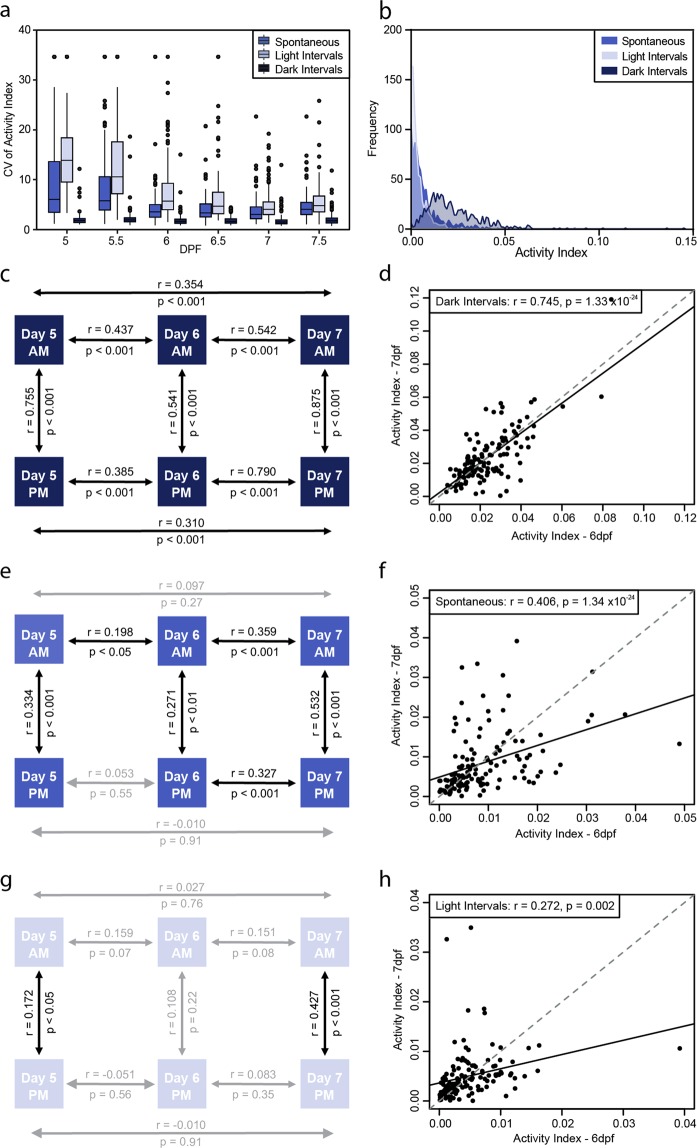
Behavioral intra-individual variability in a population of 132 larvae for the activity index. (a) Boxplot of the coefficient of variation of activity index for each individual larva (n = 132) over the different days (days post fertilization; dpf) under the different conditions studied. (b) Frequency distribution of the activity index in spontaneous, light and dark intervals depicting the differential activity profiles under these conditions. Schematics represent correlations of activity between different days and times of day for each of the conditions of study, (c) dark intervals, (e) spontaneous and (g) light intervals. Correlation plots between activity of larvae on day 6 vs 7 for (d) dark intervals, (f) spontaneous and (h) light intervals. Statistics on the plots represent the Pearson’s correlation coefficient and respective p value, with a linear regression line fitted for visual aid on the scatter plots (black solid line) and unity line (grey dashed line).

Acknowledgments
This image is the copyrighted work of the attributed author or publisher, and ZFIN has permission only to display this image to its users. Additional permissions should be obtained from the applicable author or publisher of the image. Full text @ Sci. Rep.