IMAGE

Fig. 4

ID
ZDB-IMAGE-191230-680
Source
Figures for Wu et al., 2019
Image
Figure Caption

Fig. 4

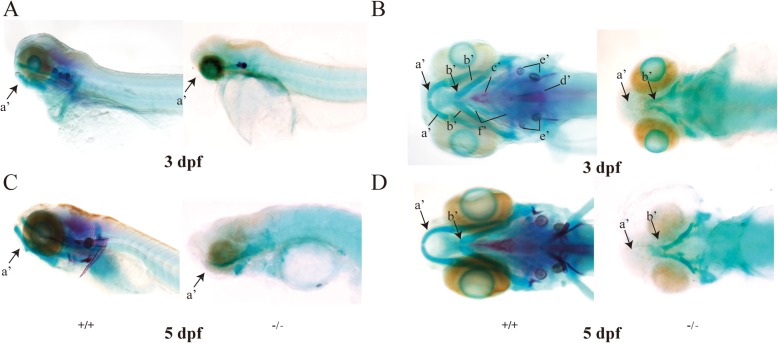
Zebrafish subjected to eftud2 gene knockout had aberrant cartilage and bone development. a, c Lateral view of larvae treated with eftud2 TALEN mRNA (−/−) at 3 dpf and 5 dpf, exhibiting disruption of cartilage and bone formation compared with WT (+/+). b, d Ventral view of larvae treated with eftud2 TALEN mRNA (−/−) at 3 dpf and 5 dpf, showing cartilage and bone hypoplasia and otolith loss compared with WT (+/+). (The images on the left are WT controls, and those on the right are eftud2 mutants. Black arrows indicate the jawbone. a’ Meckel’s bone. b’ Ceratohyal bone. c’ Parasphenoid. d’ Notochord. e’ Otolith. f’ Ceratobranchial 1–5)

Figure Data
Acknowledgments
This image is the copyrighted work of the attributed author or publisher, and ZFIN has permission only to display this image to its users. Additional permissions should be obtained from the applicable author or publisher of the image. Full text @ Hum. Genomics