IMAGE

Figure 5.

ID
ZDB-IMAGE-191230-598
Source
Figures for Sharma et al., 2019
Image
Figure Caption

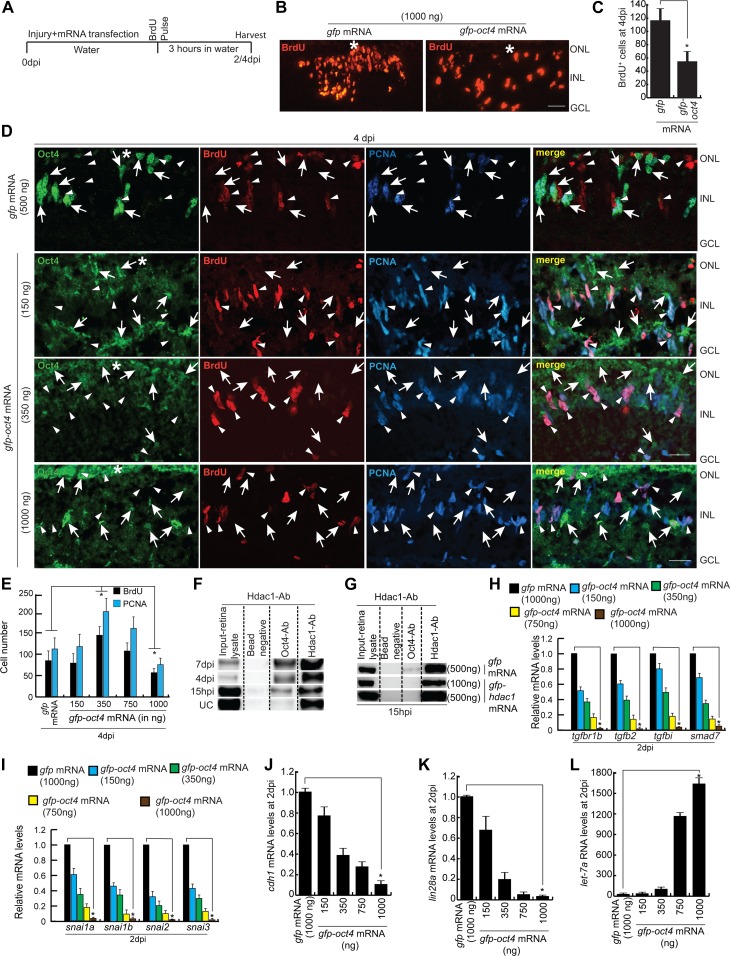
Figure 5. Effect of Oct4 overexpression in the injured retina.

(A) An experimental timeline that describes the mRNA transfection and BrdU pulse (for 4 dpi collection) before harvesting either at 2 or 4 dpi. (B, C) IF confocal microscopy images of retinal cross sections show reduced BrdU+ MGPCs at 4 dpi in oct4 mRNA transfected condition, compared with gfp mRNA-transfected control retina (B), which is quantified (C); *P < 0.0001 (t test), N = 4. (D) IF confocal microscopy images of retinal cross sections of oct4 mRNA-transfected retina at 4 dpi shows the cells with strong expression of Oct4 having a significant seclusion from PCNA+/BrdU+ MGPCs. White arrowheads mark BrdU+/PCNA+ cells and white arrows mark Oct4+ cells. (E) Quantification of BrdU+ and PCNA+ cells from oct4-overexpressed retina. (F) Western blot analysis of Co-IP of Oct4 and Hdac1 in retinal extracts at various time points postinjury probed with anti-Hdac1 antibody. (G) Western blot analysis of Co-IP of Oct4 and Hdac1 in retinal extracts obtained after hdac1 overexpression at 15 hpi and probed with anti-Hdac1 antibody. (H, I, J, K, L) The qRT-PCR analysis reveals the levels of tgfbr1b, tgfb2, tgfbi, smad7 (H), snails (I), cdh1 (J), lin28a (K), and let-7a miRNA (L) in oct4 mRNA-transfected retina at 2 dpi; *P < 0.001 (t test), N = 4. Error bars are SD. (B, D) Scale bars, 10 μm; the asterisk marks the injury site; GCL, ganglion cell layer; INL, inner nuclear layer; ONL, outer nuclear layer (B, D).

Acknowledgments
This image is the copyrighted work of the attributed author or publisher, and ZFIN has permission only to display this image to its users. Additional permissions should be obtained from the applicable author or publisher of the image. Full text @ Life Sci Alliance