
|
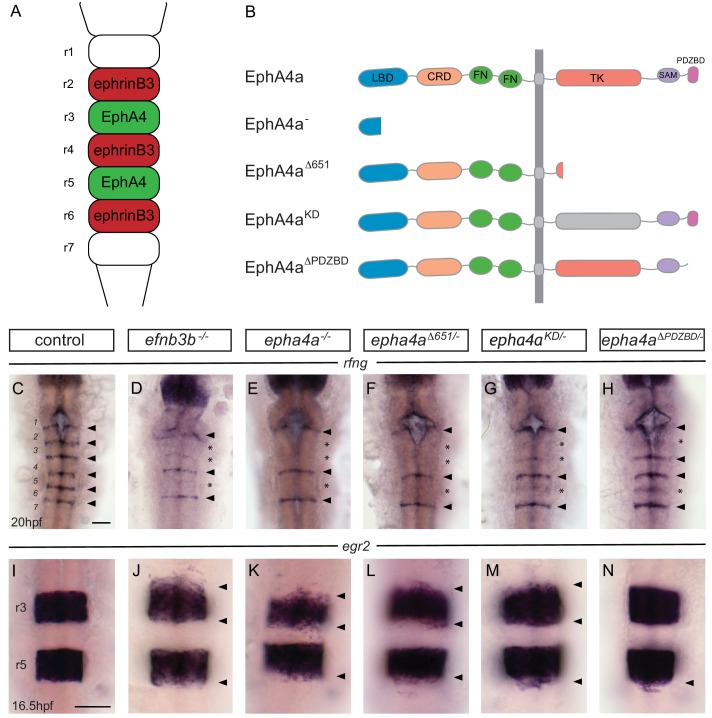
Figure 2 EphA4 forward signalling regulates boundary marker expression and cell segregation. (A) Schematic representation of the segmented expression of EphA4 and ephrinB3 in the hindbrain. (B) Schematic representation of the different mutant alleles of ephA4a generated for this study. The null allele contains an early truncation in the ligand binding domain. The epha4Δ651 allele lacks most of the cytosolic domain. The ephA4KD allele contains a point mutation of a critical lysine in the tyrosine kinase domain. The ephA4ΔPDZBD mutation consists of a C-terminal truncation that deletes the PDZ-binding domain. LBD – ligand binding domain; CRD – cysteine rich domain; FN – fibronectin repeat; TK – tyrosine kinase domain; SAM – sterile alpha motif; PDZBD – PDZ binding domain. (C–H) rfng is expressed at boundaries in control embryos (arrowheads) (C), but is reduced or absent (asterisk) at specific boundaries in ephrinb3-/- (D), epha4-/- (E), epha4Δ651 (F), epha4KD (G) and epha4ΔPDZBD (H) mutants. Numbers analysed for C-G are in Figure 4 legend. For H, 8/8 have decrease at r2/r3, 4/8 at r5/r6. (I–N) egr2 expression in r3 and r5 has sharp borders in control embryos (I, 13/13); border sharpening defects (arrowheads) are observed in ephrinb3-/- (J; 12/12), epha4-/- (K; 17/17), epha4Δ651 (L; 8/8), epha4KD (M; 6/6) and epha4ΔPDZBD (N; 2/7 at r2/r3; 7/7 at r5/r6) mutants. Dorsal views, anterior to the top in all panels. Scale bar: 50 μm.