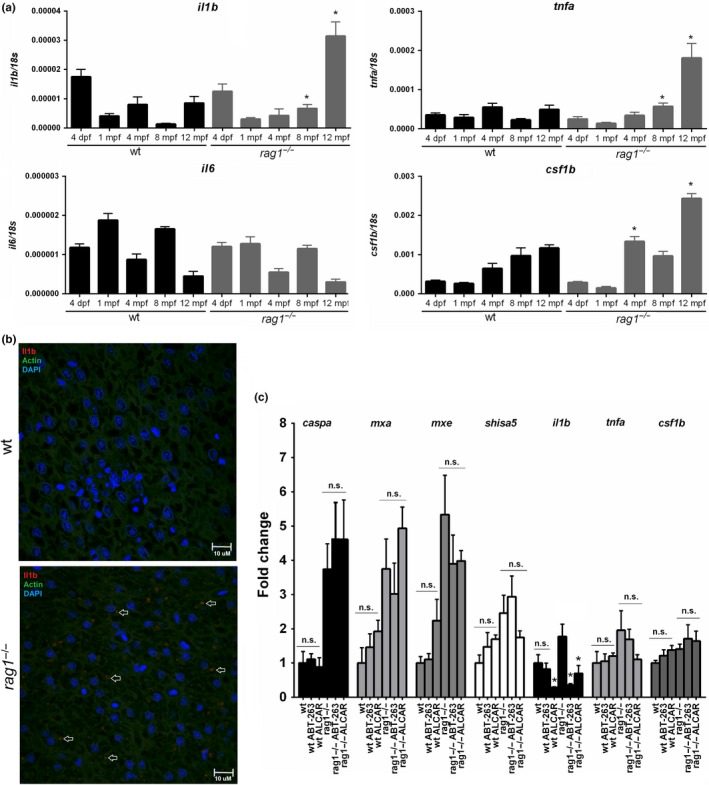
IMAGE

Figure 6

ID
ZDB-IMAGE-191230-327
Genes
Antibodies
Source
Figures for Novoa et al., 2019
Image
Figure Caption

Figure 6

Gene expression of typical SASP components in rag1−/− and wt zebrafish and effect of the senolytic drugs in the expression of immune genes differentially expressed between both zebrafish lines. (a) Comparison of the expression of potential SASP genes in wt and rag1−/− zebrafish at different ages. The expression level of each gene is normalized to the expression of the 18s gene. The graphs represent the means ± SEM of four independent biological replicates. Significant differences between wt and rag1−/− fish at each sampling point are displayed as *(0.01 < p < 0.05). (b) Il1b detection in liver sections from one‐year‐old wt and rag1−/− zebrafish. Arrows indicate Il1b‐positive dots. (c) Effect of the one‐month‐long treatment with ABT‐263 and ALCAR in the transcription of different genes differentially expressed between one‐year‐old rag1−/− and wt zebrafish. The expression level of each gene was normalized to 18s gene expression and is expressed as the fold change with respect to the levels detected in the untreated wt fish. The graphs represent the means ± SEM of five independent biological replicates. Significant differences between wt and rag1−/− fish at each sampling point are displayed as *(0.01 < p < 0.05)

Figure Data
Acknowledgments
This image is the copyrighted work of the attributed author or publisher, and ZFIN has permission only to display this image to its users. Additional permissions should be obtained from the applicable author or publisher of the image. Full text @ Aging Cell