
|
Figure 6
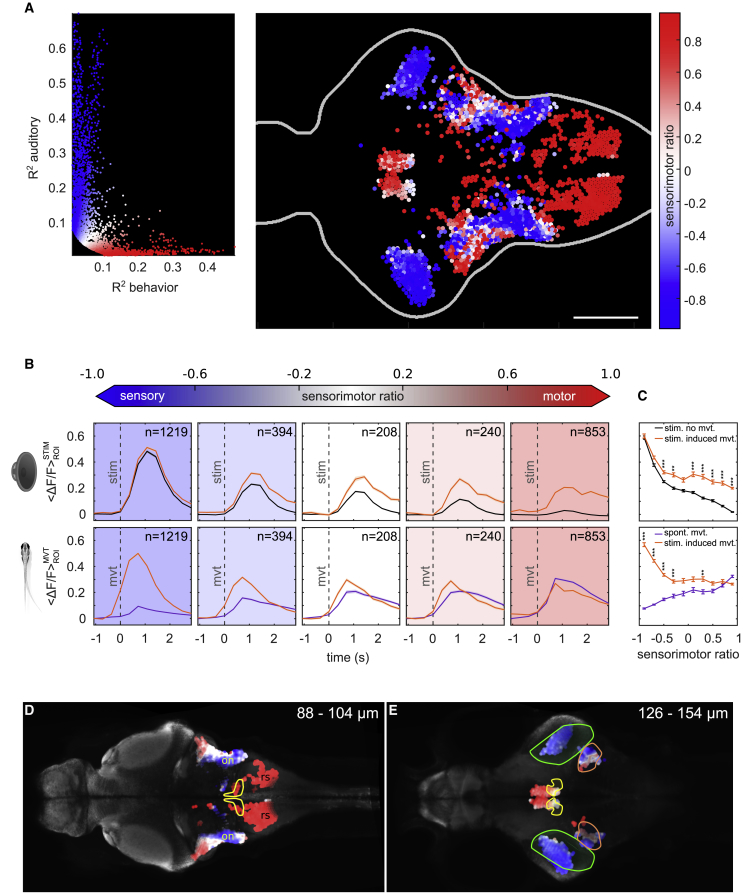
Sensorimotor Properties of the Auditory Neural Circuit
(A) Left: distribution of ROIs R2 values for movement and behavior with the corresponding sensorimotor ratio value. Right: topography of ROI’s sensorimotor ratio for 10 larvae at 8 dpf is shown. Scale bar, 100 μm.
(B) Top: average ΔF/F over ROIs after an auditory stimulation around auditory stimulus onset (t = 0 s) for ROIs grouped in 5 bins according to their sensorimotor ratio. Stimulus frequencies from 150 to 450 Hz were pooled together. Orange curve, stimulus followed by a tail movement within a 500-ms time window after stimulus onset. Black curve, stimulus not followed by a tail movement. Bottom: average ΔF/F across ROIs when the fish moved is shown (t = 0 s: movement onset). Orange curve, tail movement preceded by an auditory stimulation. Purple curve, self-generated movement. In the bottom panels, the delay between the orange curve (stimulus-induced movement) and the purple curve (self-generated movement) corresponds to sensory processing, because the stimulus occurs before the movements.
(C) Average peak ΔF/F value (mean ± SEM) across ROIs around auditory stimulus onset (top panel) or tail movement onset (bottom panel). ROIs were binned into 10 groups based on their sensorimotor ratio value. Bins were compared using the two-tailed Wilcoxon rank sum test, and p values were subsequently adjusted using Bonferroni correction.
(D) The topography of the sensorimotor ratio (blue, sensory; white, sensorimotor; red, motor), superimposed to the Elavl3-GCaMP5 line in the z-brain atlas. Yellow, facial motor and octavolateralis efferent; on, octaval nuclei; rs, reticulospinal circuits. Top right corner: depth of the imaged plane is shown.
(E) The topography of the sensorimotor ratio over the Elavl3-GCaMP5 line in the z-brain atlas. Green, torus semicircularis; yellow, nucleus of the medial longitudinal fascicle; orange, cerebellar vglut2-enriched area. Top right corner: depth of the imaged plane is shown. See also