
|
Figure 5
Auditory-Induced Tail Motor Behaviors
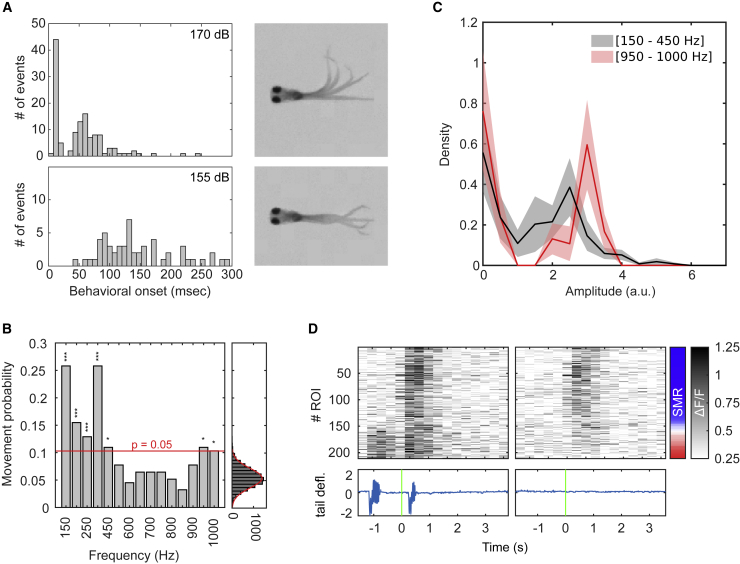
(A) Delay histogram between the onset of auditory stimulation and the onset of tail movements (7 larvae) Top: auditory stimulation using 170 dB re 1 μPa stimuli resulted in a bimodal distribution probably representing short latency C-starts and long-latency C-starts. Bottom: auditory stimulation using 155 dB re 1 μPa stimuli resulted in a distribution of longer and more variable latencies.
(B) Probability of having at least one tail bout in a 500-ms time window after stimulus onset for each frequency. A null model was created by generating data following the same inter-bouts interval distribution as the experimental data (left). p values were computed using the null model distribution and subsequently adjusted using Bonferroni correction. Red dashed line, significance threshold for α = 0.05 after Bonferroni correction. n = 10 larvae.
(C) Average density distribution (mean ± SEM) of bout amplitudes (10 larvae), elicited by low-frequency stimuli (150 Hz and 450 Hz; 134 bouts) in black and high-frequency stimuli (950 Hz and 1,000 Hz; 30 bouts) in red. The amplitude of a tail bout was defined as the maximum curvature during the bout. The medians of the two distributions were not significantly different (p = 0.73; two-sided rank-sum test).
(D) Top: single trial raster on a single larva. ROIs are ordered by their sensorimotor ratio, computed as (R2mvt − R2stim)/(R2mvt + R2stim). The sensorimotor ratio ranges from −1 (sensory ROIs, in blue) to +1 (behavior-related ROIs, in red). Bottom: tail deflection is shown, green bar, auditory stimulus onset.