
|
Figure 4
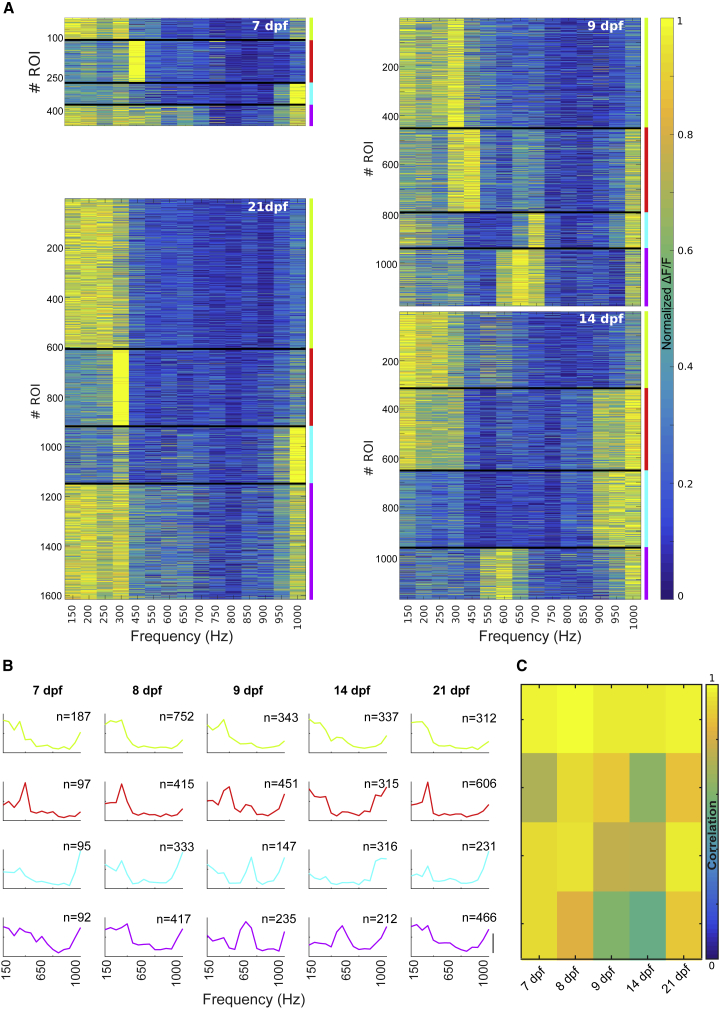
Frequency Tuning Curves at Different Developmental Stages
(A) Frequency tuning curves grouped in 4 clusters using k-means clustering algorithm at 7 dpf (6 larvae), 9 dpf (11 larvae), 14 dpf (3 larvae), and 21 dpf (5 larvae).
(B) Average normalized tuning curves across ROIs grouped in 4 clusters throughout the larva’s development, from 7 to 21 dpf. Similar tuning curves were assigned to the same cluster across developmental stages by maximizing the correlation between the tuning curves and the average tuning across ages. Scale bar, 0.5 ΔF/F. The colors represent the clusters indicated in (A). Top right corner: the number of ROIs per cluster is shown.
(C) Correlation matrix used to order the clusters in (B). We correlated the tuning curve for each cluster at each developmental stage with the average tuning curve across ages. All possible permutations of cluster assignments were tested. The matrix shows the solution that maximized the average correlation. Average correlation: 0.85 ± 0.14 (SD).