
|
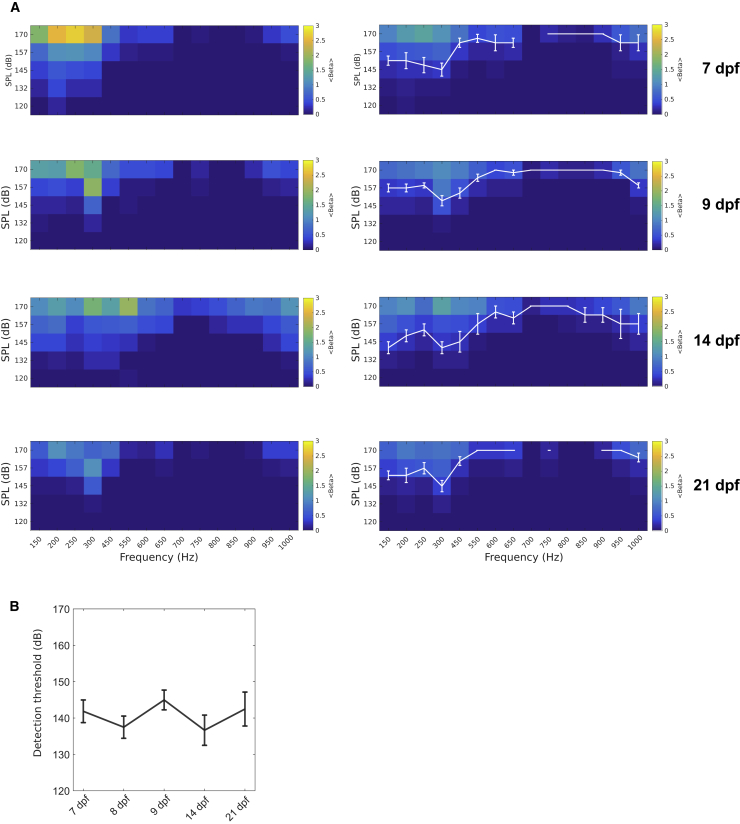
Figure 3
Audiograms at Different Development Stages
(A) Right: average audiogram at 7 dpf (4 larvae), 9 dpf (7 larvae), 14 dpf (3 larvae), and 21 dpf (5 larvae) measured as the amplitude of the neuronal response fit by a linear regression model, averaged over all ROIs in the brain. White curve: average threshold and SEM are shown. Left: single larva example is shown.
(B) Detection threshold, the lowest amplitude at which a neuronal response was detected, averaged across larvae during the different developmental stages (mean ± SEM). Means at different ages were not significantly different (p = 0.4381; one-way ANOVA). See also