
|
Figure 1
Experimental Setup for Acoustic Stimulation and Simultaneous Recording of Neural Activity and Behavior
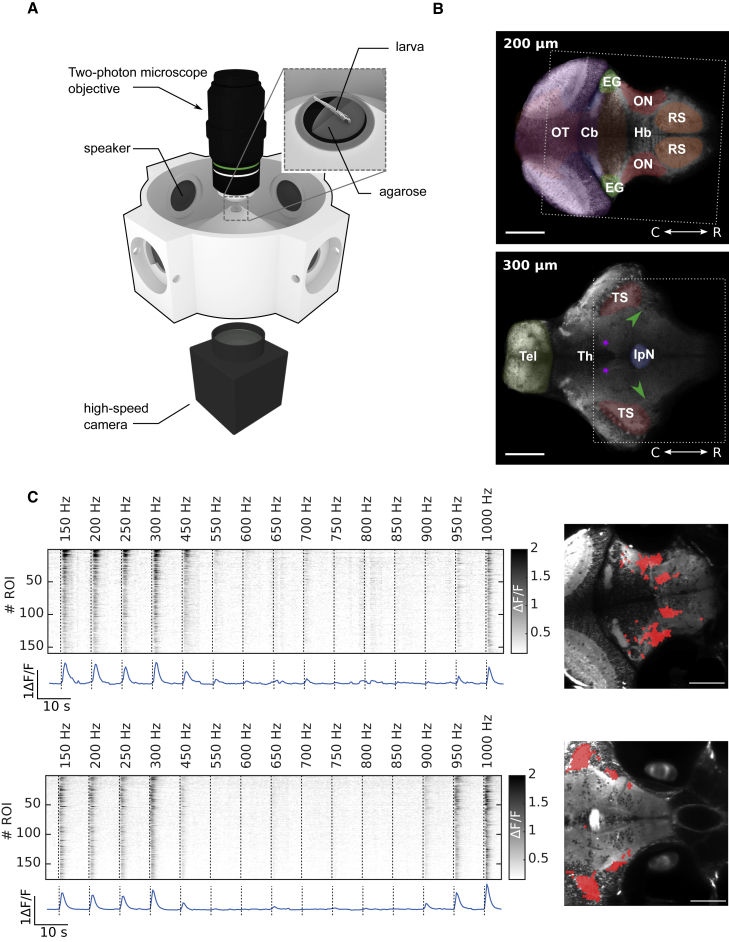
(A) Zebrafish larvae were head restrained in a drop of low-melting-point agarose inside a 3D-printed recording chamber. Acoustic stimulations (pure tones at different frequencies) were delivered using waterproof speakers. Spontaneous and evoked neuronal activity was monitored by two-photon calcium imaging while movements of the tail were simultaneously recorded with a high-speed camera.
(B) Two optical sections of a larva’s brain pan-neuronally expressing GCaMP5 (Huc:GCaMP5). Cb, cerebellum; EG, eminentia granularis; Hb, hindbrain; IpN, interpeduncular nucleus; ON, octaval nuclei; OT, optic tectum; RS, reticulospinal neurons; Th, thalamus; Tel, telencephalon; TS, torus semicircularis. Green arrowheads, lateral longitudinal fascicle; purple asterisks, nucleus of the medial longitudinal fascicle. Scale bars, 100 μm. Dotted rectangles correspond to area displayed in (C).
(C) Two examples of sensory activity in the octaval nuclei (top) and torus semicircularis (bottom). Top: raster example for one larva averaged across trials for each stimulus frequency is shown. Bottom: activity averaged across ROIs is shown. Right: topography of ROIs selected as responsive using linear regression corresponding to the rasters on the left is shown. Scale bar, 100 μm. See also