IMAGE

Figure 1

ID
ZDB-IMAGE-191230-1350
Genes
Source
Figures for Hassan-Abdi et al., 2019
Image
Figure Caption

Figure 1

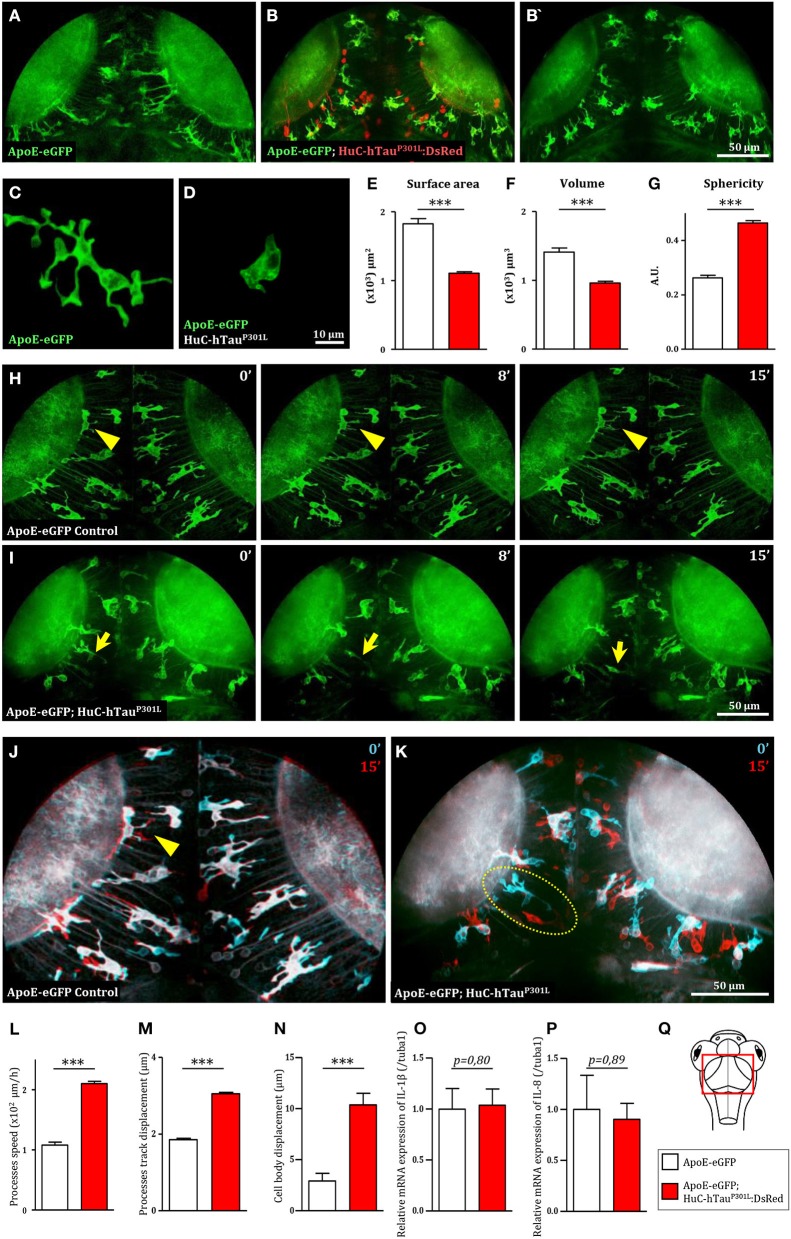
Microglia displays dramatic changes in morphology and dynamics in the presence of hTauP301L-expressing neurons. (A,B,B') Dorsal views of the optic tectum of 7 dpf Tg(ApoE-eGFP) (A) and Tg(ApoE-eGFP; HuC-hTauP301L:DsRed) transgenic embryos (B,B'), showed the characteristic ramified morphology of microglia in wild-type (A), while in the presence of hTauP301L-expressing neurons, microglial cells displayed shorter processes and larger cell bodies. (C,D) Detailed morphology of microglial cells in Tg(ApoE-eGFP) (C) and Tg(ApoE-eGFP; HuC-hTauP301L:DsRed) embryos (D). (E–G) Measurements of microglia morphological parameters; surface area (E, p < 0.0001), volume (F, p < 0.0001), and sphericity (G, p < 0.0001), in Tg(ApoE-eGFP) (n = 10) and Tg(ApoE-eGFP; HuC-hTauP301L:DsRed) (n = 24) embryos, confirmed the cell shape changes observed in the presence of hTauP301L-expressing neurons. (H,I) Time-lapse sequences of microglia dynamics in Tg(ApoE-eGFP) (H, Supplementary Video 1) and Tg(ApoE-eGFP; HuC-hTauP301L:DsRed) embryos (I, Supplementary Video 2). (J,K) Merged images of two time points separated by 15 min from Supplementary Video 1(J) and Supplementary Video 2(K). The merged images at t = 0 min (cyan) and t = 15 min (red) highlighted the dramatic increased mobility of microglial cell bodies in the presence of hTauP301L-expressing neurons. (L–N) Measurements of microglia dynamics; process speed (L, p = 0.0004), process track displacement (M, p = 0.0002) and cell body displacement (N, p = 0.0054), in Tg(ApoE-eGFP) (n = 3) and Tg(ApoE-eGFP; HuC-hTauP301L:DsRed) (n = 4) embryos, confirmed the increased mobility of both microglia processes and cell bodies observed in the presence of hTauP301L-expressing neurons. (O,P) Measurements of pro-inflammatory cytokine expression in the brain of 5 dpf Tg(ApoE-eGFP) (n = 6) and Tg(ApoE-eGFP; HuC-hTauP301L:DsRed) (n = 11) embryos. Comparison of the relative expression of IL-1β (O, p = 0.80) and IL-8 (P, p = 0.89) in both groups shows no significant differences. (Q) Schematic dorsal view of a 7 dpf zebrafish embryo. The red square shows the region of interest that comprises the optic tectum. ***p < 0.001. Scale bar (A,B,B',H–K) = 50 μm, (C,D) = 10 μm. A.U., arbitrary units.

Figure Data
Acknowledgments
This image is the copyrighted work of the attributed author or publisher, and ZFIN has permission only to display this image to its users. Additional permissions should be obtained from the applicable author or publisher of the image. Full text @ Front. Neurosci.