
|
Fig 5
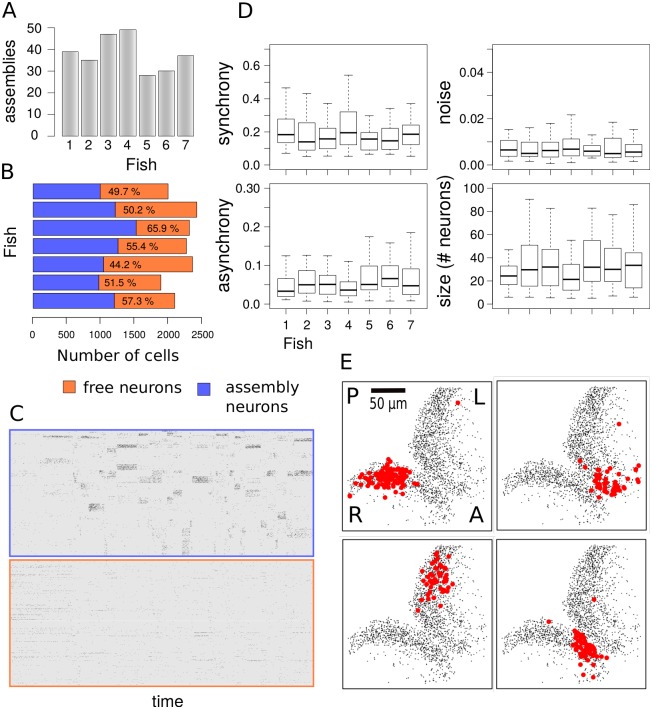
(A) Number of neuronal assemblies estimated for each fish. (B) Fraction of neurons assigned to assemblies with 99% confidence. The efficacy of our method in capturing neuronal assemblies is illustrated by separating the activity matrix of assembly neurons from neurons which are not part of a coherent assembly. (C) When sorting the activity matrix by membership, neurons that are part of an assembly generate bands of synchronous activity whereas neurons that are not assigned to an assembly display independent random firing events. (D) Comparison of synchrony, asynchrony, activity and assembly sizes for all experiments. Synchrony and asynchrony correspond to the model parameters λ(1) and λ(0), as the probabilities of a neuron to fire with its assembly (synchronous activation) and independently of it (asynchronous activation). The activity corresponds to the probability of an assembly to be active at any time during the 1 hour recording period. (E) Representative assemblies from single fish with high synchrony and activity display spatial compactness within left or right tectal hemispheres. Labels A/P and R/L indicate anterior/posterior axis and right/left optic tectum respectively. Assembly maps are obtained by projecting in 2D the positions of all member neurons across the five imaging planes.