
|
Figure 2
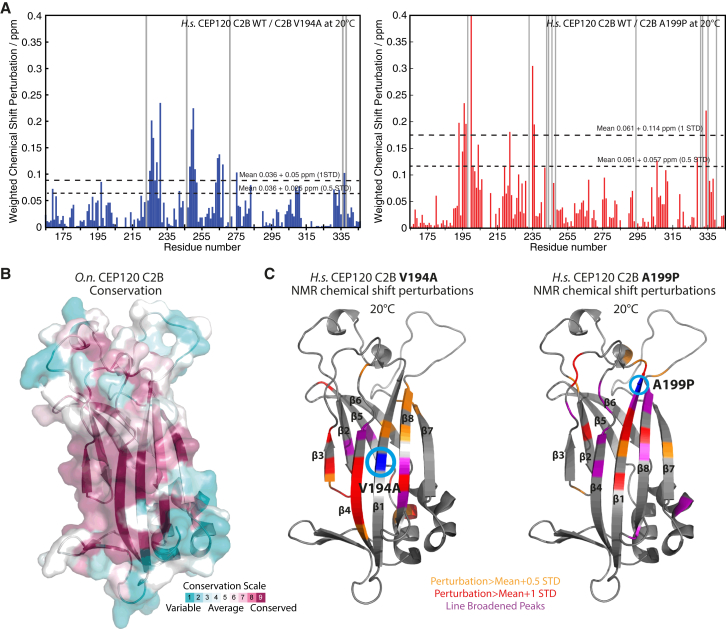
JS (V194A) and JATD (A199P) Mutations in Human CEP120 Cause Subtle Changes in the C2B Domain Structure
(A) Per-residue plot of the weighted chemical shift perturbations of the human CEP120 C2B V194A (left) and A199P mutant (right) relative to the WT protein observed in 1H,15N BEST-TROSY NMR spectra at 20°C. Gray bars indicate line-broadened peaks.
(B) Molecular surface representation of the
(C) Homology model of human CEP120 C2B as ribbon representation. The weighted chemical-shift perturbations of the human CEP120 C2B V194A (left) and A199P mutant (right) relative to the WT protein as observed in (A) are plotted color-coded onto this model.
See also