IMAGE

Fig 1

ID
ZDB-IMAGE-191230-1088
Source
Figures for Marquart et al., 2019
Image
Figure Caption

Fig 1 Ballistic and delayed escape reactions performed by larval zebrafish.

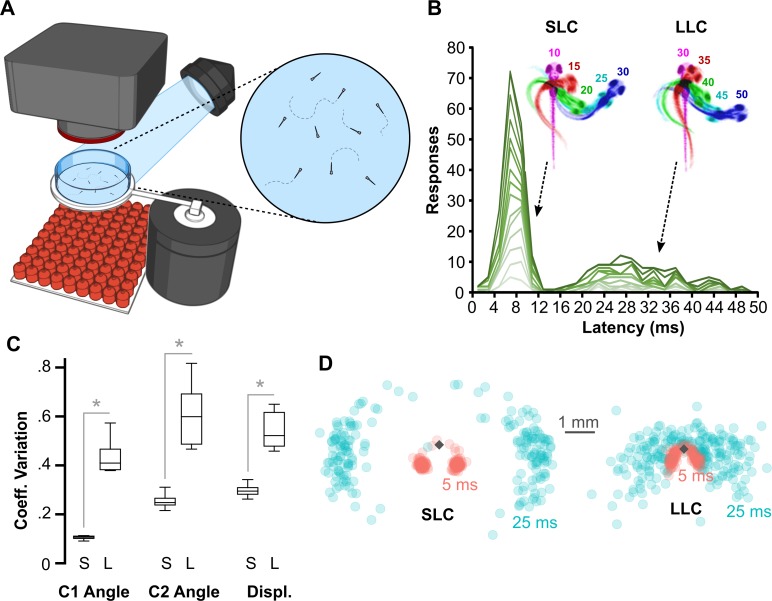
(A) Schematic of behavioral experiments in free-swimming larvae: groups of 15–20 6-dpf larvae were imaged from above at 1,000 frames per second with a high-speed camera. An infrared LED array below provided illumination. Nondirectional acoustic/vibratory stimuli were delivered to the arena by a minishaker. (B) Frequency histogram of response latencies for individual larvae (n = 15). Inset: Time-lapse images of initial C-bend for larvae performing an SLC or an LLC, color-coded by millisecond poststimulus. (C) Coefficient of variation (“Coeff. Variation”) for the initial bend angle (“C1”), counterbend angle (“C2”), and net displacement (“Displ.”) for SLC (“S”) and LLC (“L”) responses. n = 16 groups of larvae. *p < 0.001, paired t test. (D) Spatial distribution of head locations 5 ms (red) and 25 ms (blue) after escape initiation for SLC (n = 199) and LLC (n = 220) reactions, relative to initial position (diamond). Underlying numerical data are included in S1 Data. dpf, day post-fertilization; LED, light-emitting diode; LLC, long-latency C-start; SLC, short-latency C-start.

Acknowledgments
This image is the copyrighted work of the attributed author or publisher, and ZFIN has permission only to display this image to its users. Additional permissions should be obtained from the applicable author or publisher of the image. Full text @ PLoS Biol.