
|
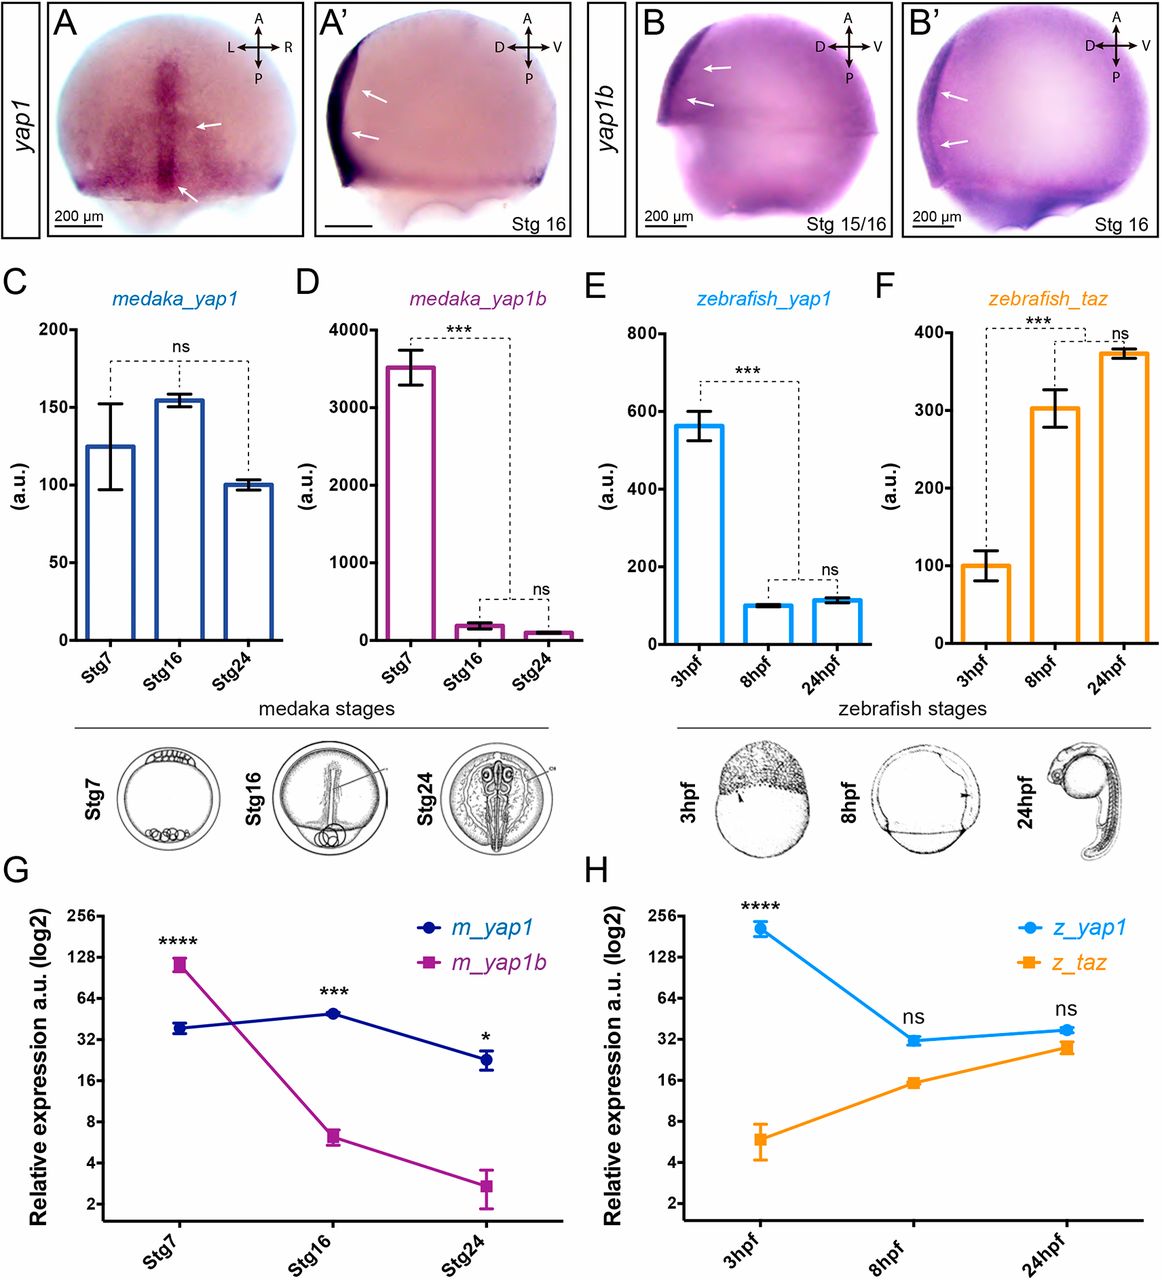
Fig. 2
Expression analysis of Yap family genes. In situ hybridization analysis of yap1 (A,A′) and yap1b(B,B′) distribution in stage 15-16 medaka embryos. Scale bars: 200 µm. Quantification of the expression levels of Yap family genes at three equivalent developmental stages (i.e. early morula, late gastrula and optic cup stages) in medaka (C,D) and zebrafish (E,F) embryos by qPCR-RT (n=3). Relative expression level between paralogous genes was determined in medaka (G) and zebrafish (H) samples by droplet digital PCR (ddPCR) (n=2). One-way ANOVA analysis followed by Fisher's LSD test was used to evaluate statistical significance. ****P<0.0001; ***P<0.001; *P<0.05; ns, not significant.