
|
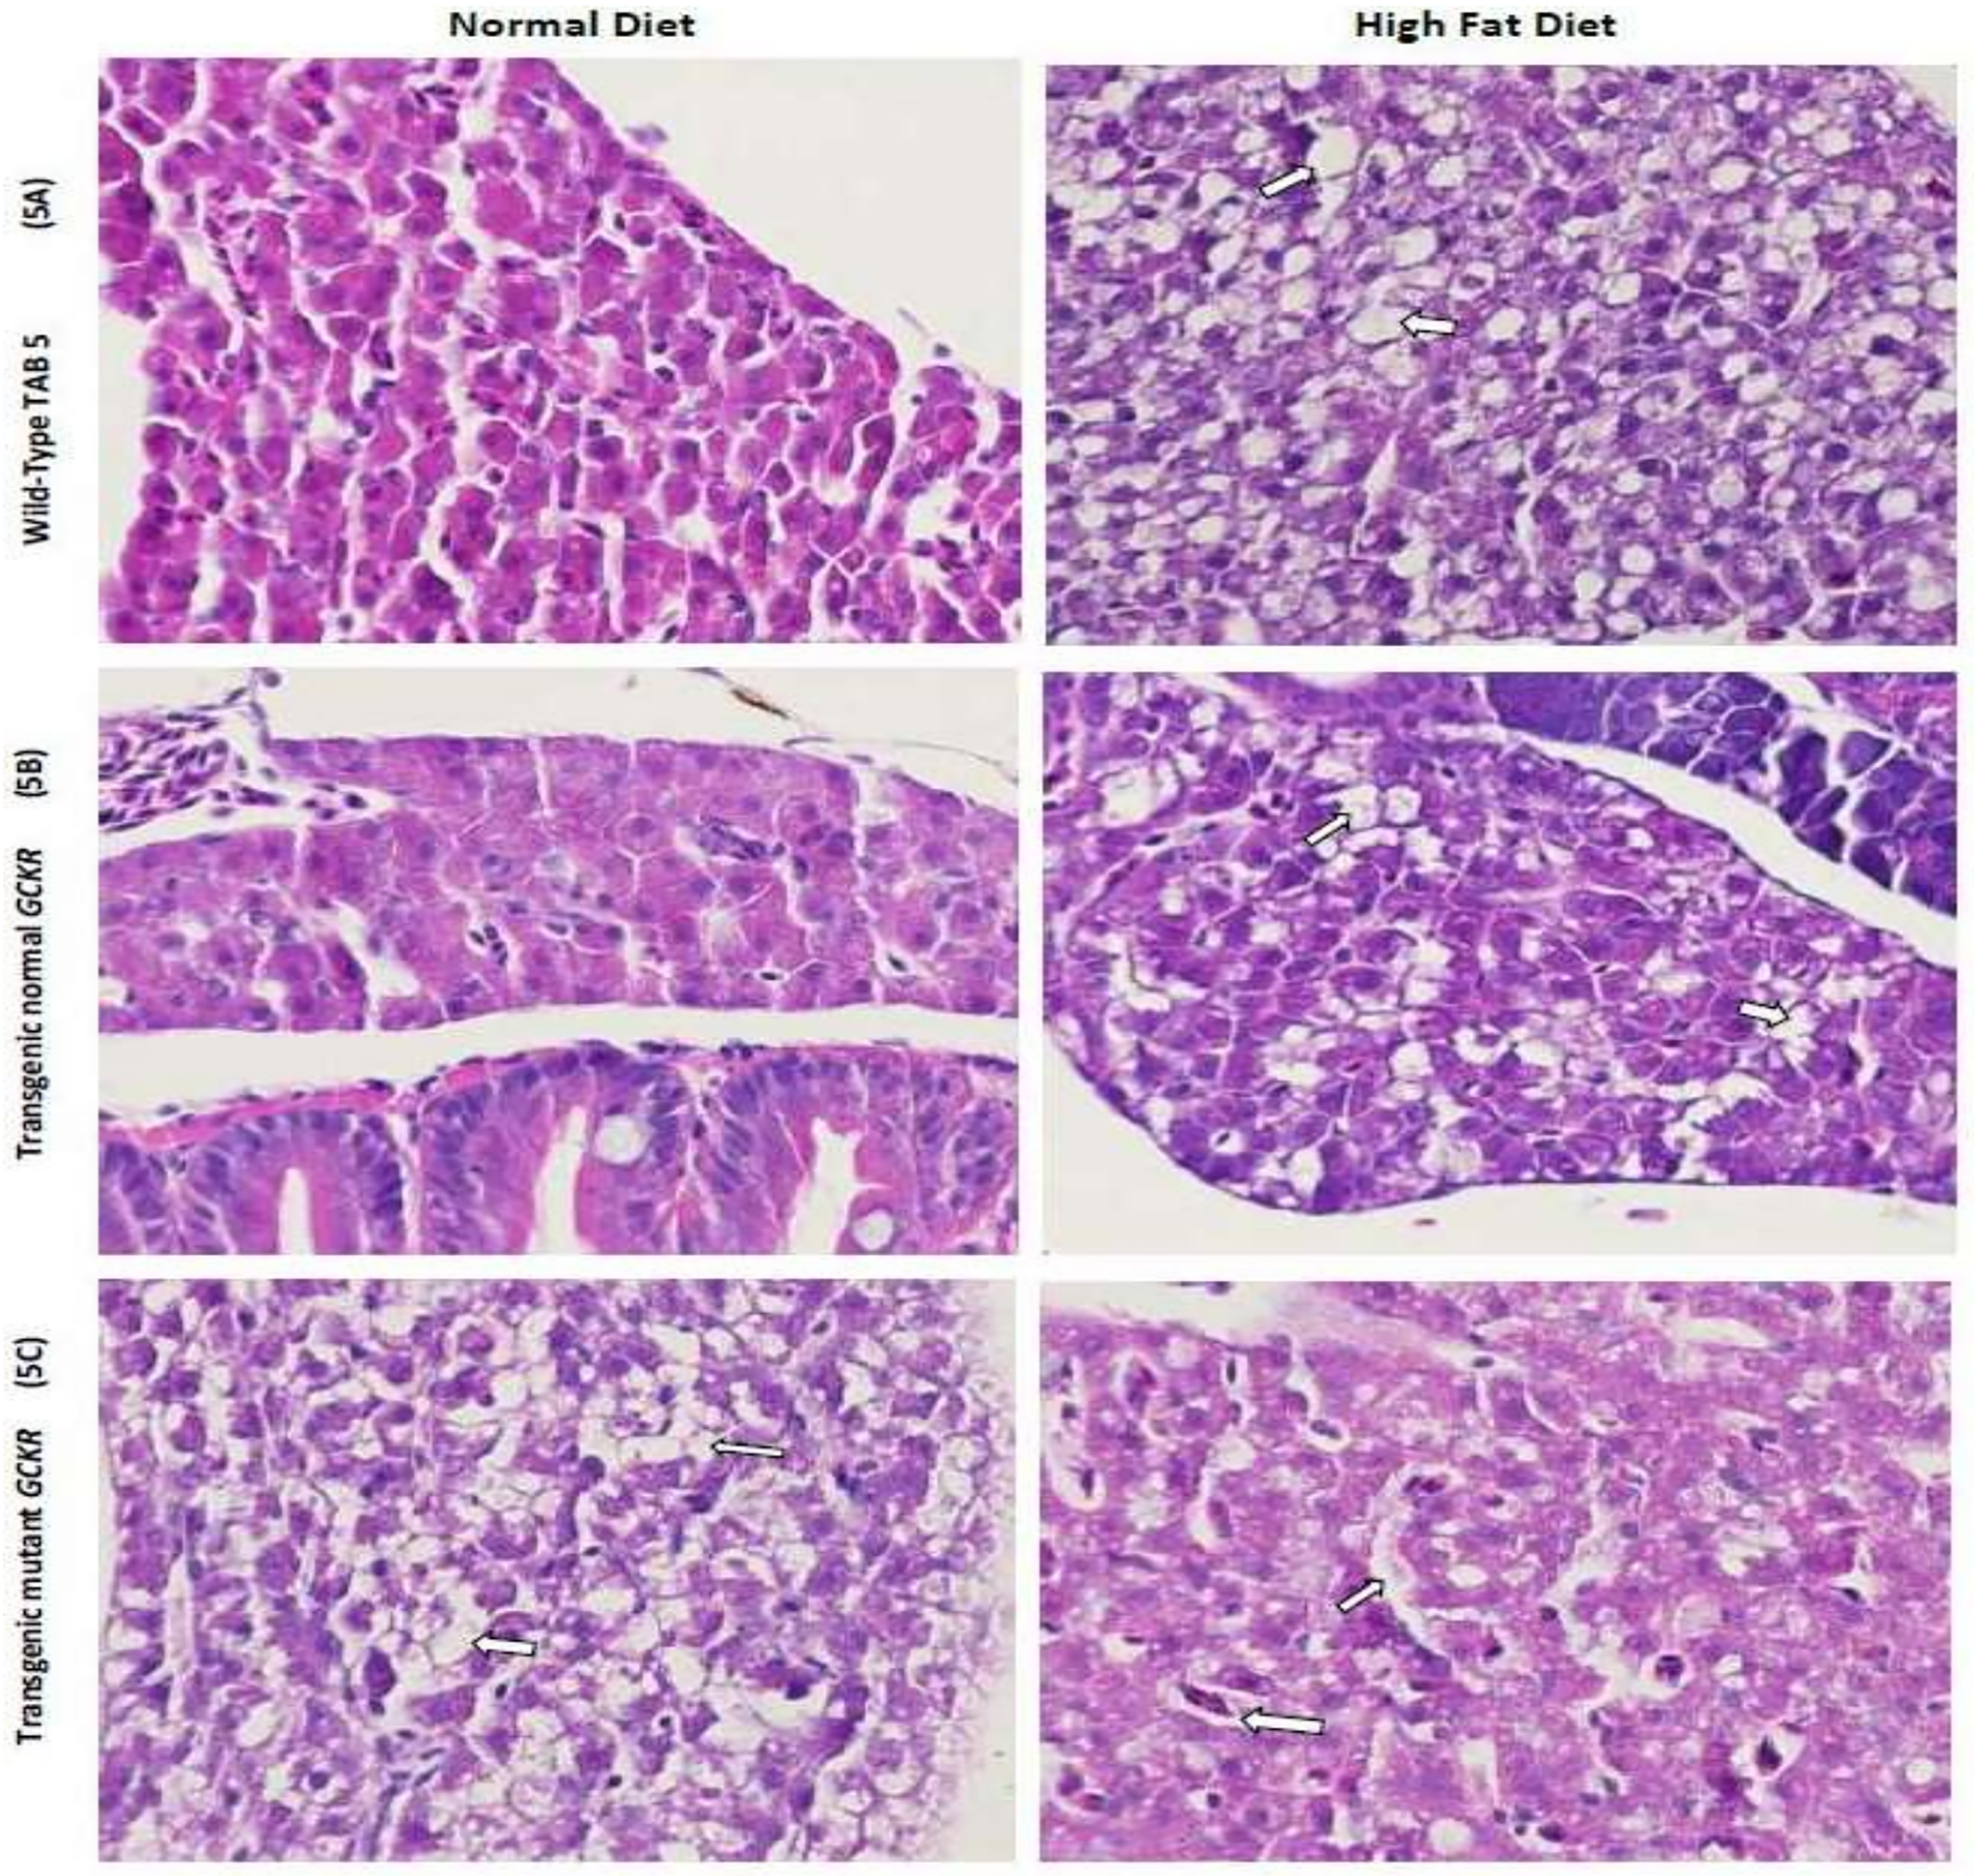
Fig. 5
A-C. Fig 5A. Zebrafish liver histology of Hematoxylin and Eosin stained sections showing cellular differences in normal and high fat feeding for 2 weeks. A. A wild-type Tab-5 liver with normal hepatic cells and HFD showing normal liver with scattered fat cells (white arrow) showing 3+ fat without apoptosis. Fig 5B. Transgenic normal GCKR with normal hepatocytes in larvae fed on normal diet and normal liver with scattered fat cells (white arrow) in transgenic larvae fed on HFD with no apoptosis. Fig 5C. Transgenic mutant GCKR with normal diet shows liver with fatty metamorphosis and scattered hepatic cell apoptosis (white arrow) with 4+ fat. Transgenic mutant GCKR with HFD shows 4+ fat with severe cellular damage and higher fatty infiltration than the normal and transgenic normal fish. Most hepatic cells also contain vacuoles of fat and there is severe disorganization of the hepatic structure.