
Fig. 8
- ID
- ZDB-IMAGE-190820-29
- Genes
- Publication
- Zhu et al., 2019 - Aplnra/b Sequentially Regulate Organ Left-Right Patterning via Distinct Mechanisms
- All Figures
- Figures for Zhu et al., 2019
|
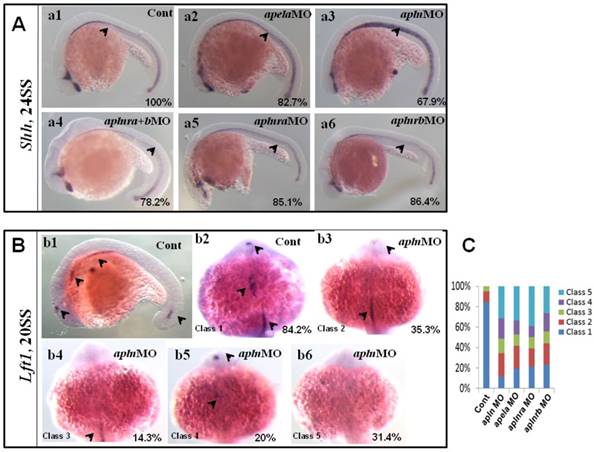
Fig. 8
Expression of midline related genes in different treated embryos. (A. a1-a6) Shh expression at 24SS. Compared with that in control embryos (A. a1, 100%, n=31), no clearly decreased or increased expression of shh in midline was found in apela morphants (A. a2, 82.7%, n=29), aplnra+b double morphants (A. a4, 78.2%, n=23), aplnra morphants (A. a5, 85.1%, n=27) and aplnrb morphants (A. a6, 86.4%, n=22). In apln morphants, the expression of shh was slightly increased (A. a3, 67.9%, n=28). (B. b1-b6, C) Expression of lft1 at 20SS. In wild type embryos lft1 was expressed in 4 domains, including left telencephalon, left heart field, trunk midline and tail midline (B. b1, black arrow head, n=45), and in dorsal view, lft1 was found to be expressed in left telencephalon, left heart field, trunk midline (B. b2, black arrow head). In apln morphants, lft1 expression was found to be decreased with different phenotypes (B. b3-b6, n=85). Among all the alpn morphants, lft1 in midline was disappeared or decreased greatly in more than half of embryos (B. b4-b6, class 3 to class 5; C, the second column, 64.7%, n=85, p<0.01). The expression pattern of lft1 in apln morphants was also found in apela morphants (C, column 3, 58.2%, n=79, p<0.01), aplnra morphants (C, column 4, 60%, n=75, p<0.01) and aplnrb morphants (C, column 5, 56.2%, n=89, p<0.01), near or more than half of embryos showed greatly decreased lft1 in the trunk midline.