
|
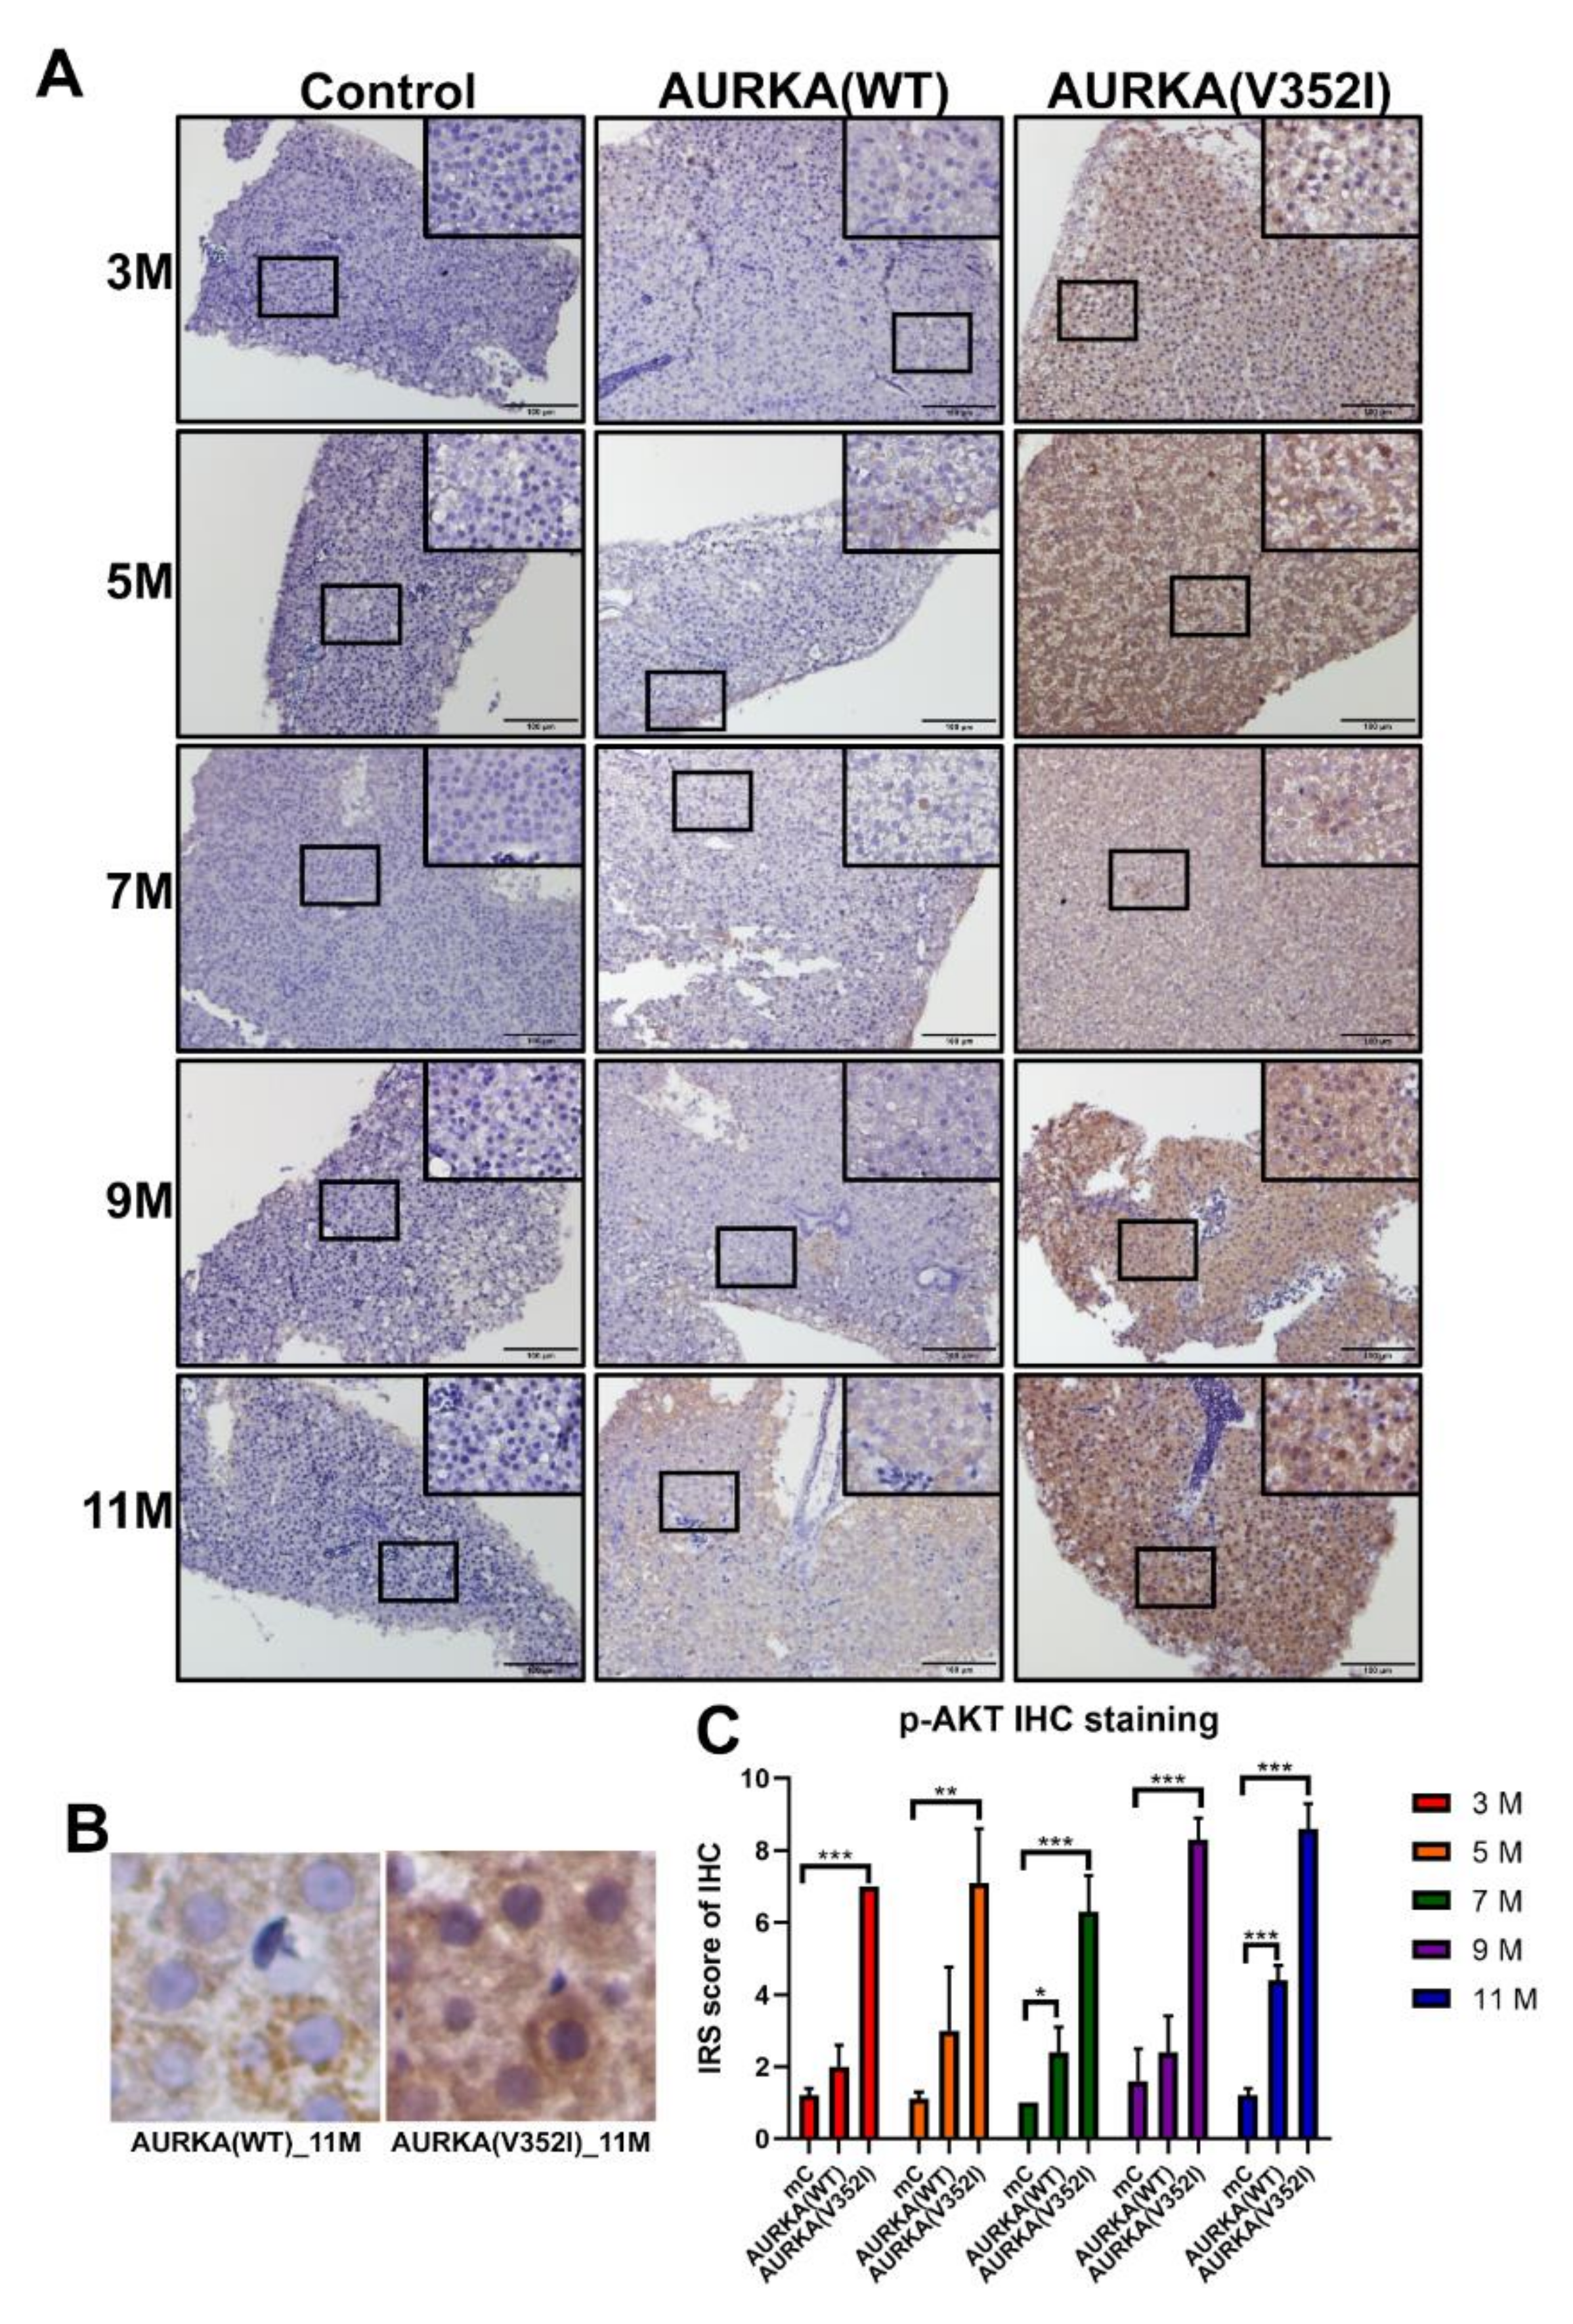
Fig. 10
Immunoreactive score of p-Akt immunostaining reveals that Akt is much more significantly activated in AURKA(V352I) than in AURKA(WT). (A) Representative images of p-AKT staining for PTEN in control, AURKA(WT), and AURKA(V352I) at 3, 5, 7, 9, and 11 months; (B) Selected enlarged images show the p-AKT signals from AURKA(WT)—11 M and AURKA(V352I)—11 M; (C) Statistical analysis of p-AKT immunostaining IRS score at 3, 5, 7, 9, and 11 months. The gray, orange, and blue colors represent control, AURKA(WT), and AURKA(V352I), respectively. Statistical analysis of results was performed using a two-tailed Student’s t-test. The error bar means standard deviation. Asterisks (*) represent the level of significance. * p-value ≤ 0.05; ** p-value ≤ 0.01; *** p-value ≤ 0.001.