
|
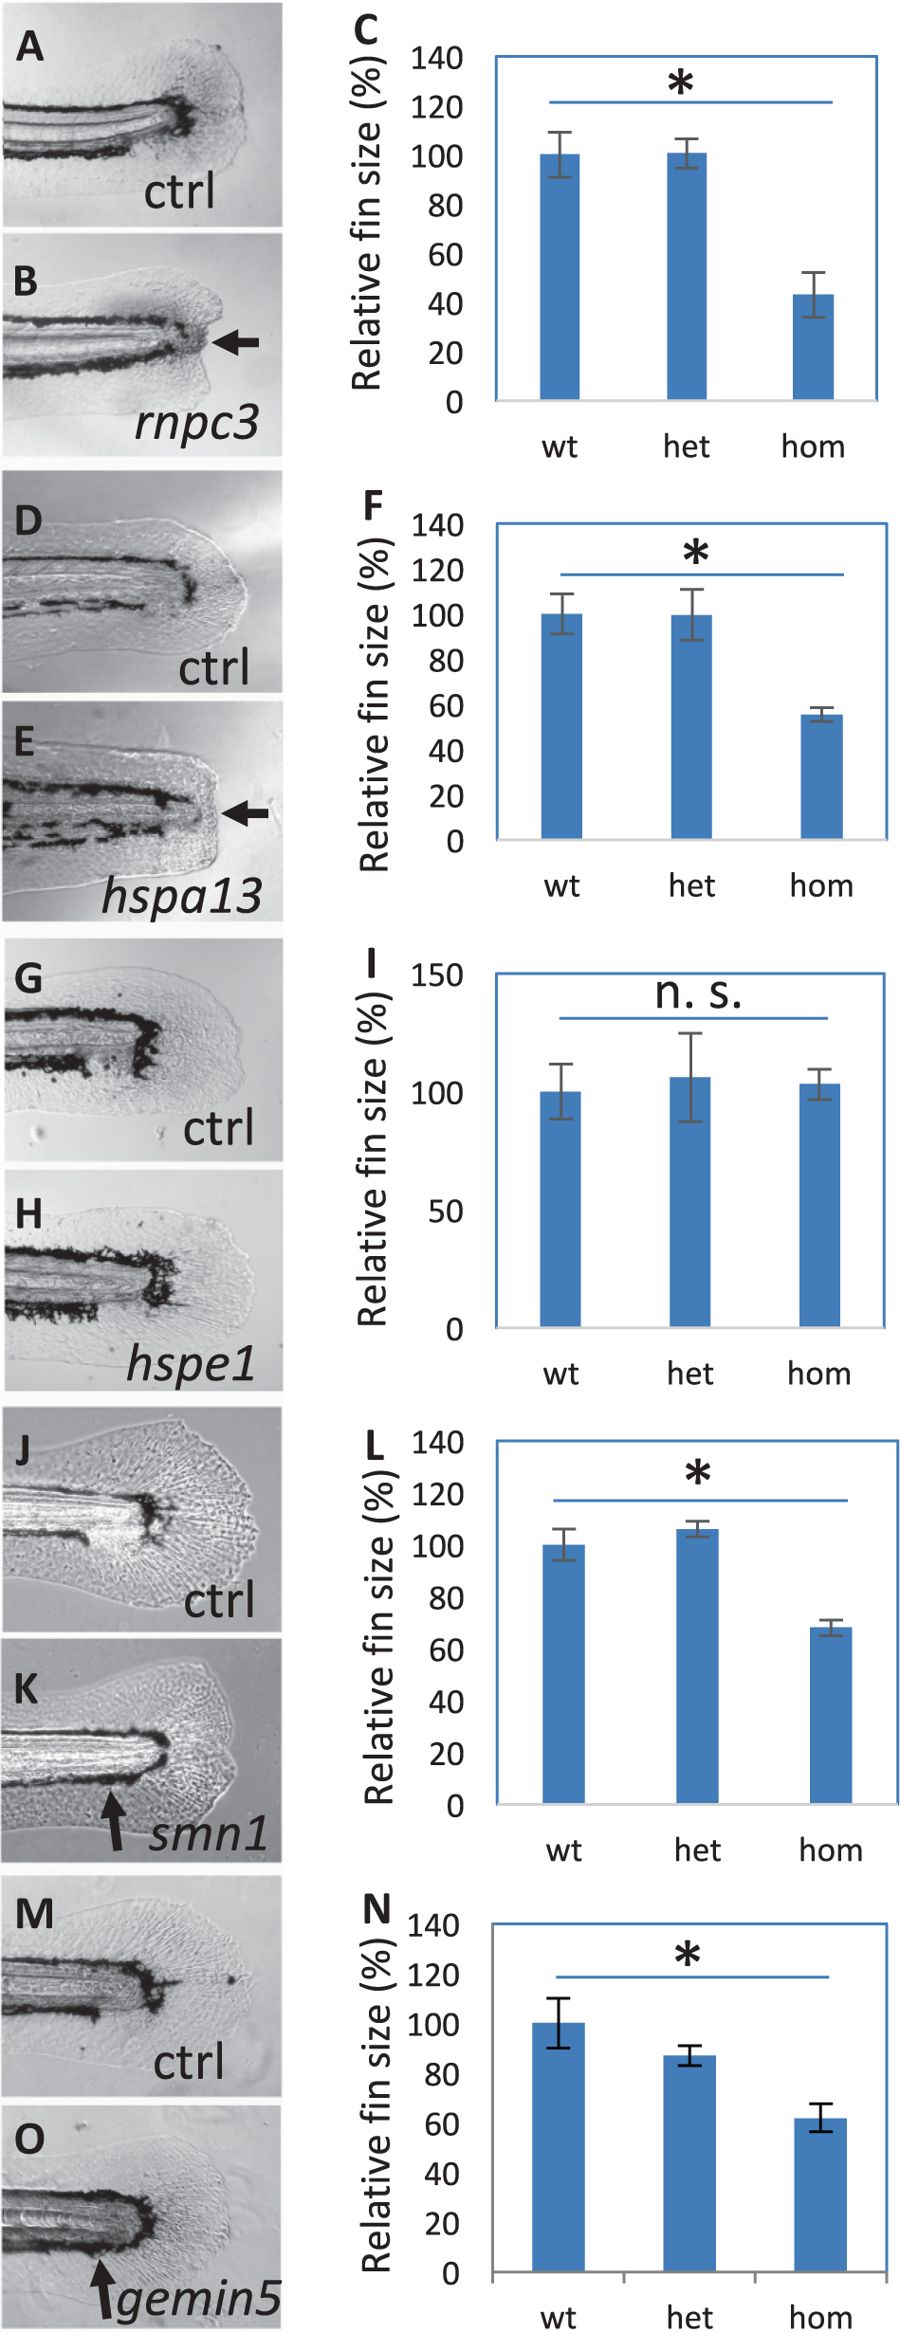
Fig. 4
Fin regeneration in the mutants affecting hair cell regeneration. a–c Regenerated fins in the control (a) and rnpc3la028632 (b), and the quantification of the fin areas (c). d–fRegenerated fins in the control (d) and hspa13hg78 mutants (e), and the quantification of the fin areas (f). g–i Regenerated fins in the control (g) and hspe1hg77 mutant (h), and the quantification of the fin areas (i). j–l Regenerated fins in the control (j) and smn1fh299 mutant (k), and the quantification of the fin areas (l). m–o Regenerated fins in the control (m) and gemin5hg80 mutant (n), and the quantification of the fin areas (o). Arrows in b and e point to a lack of caudal fin fold in rnpc3 and hspa13 mutants. Arrows in k and o point to a lack of ventral pigment gap in smn1 and gemin5 mutants. Graphs are generated by analyzing more than eight embryos per genotype. Error bars show the s.e.m. There was no difference in the regeneration between wild-type and heterozygotes for all the mutations, so control (Ctrl) is used to represent both. There is a significant difference between the wild-type and mutant embryos for mutations in rnpc3, hspa13, smn1, and gemin5 (p < 0.05 for all), but not for mutation in hspe1 (n. s.)