
|
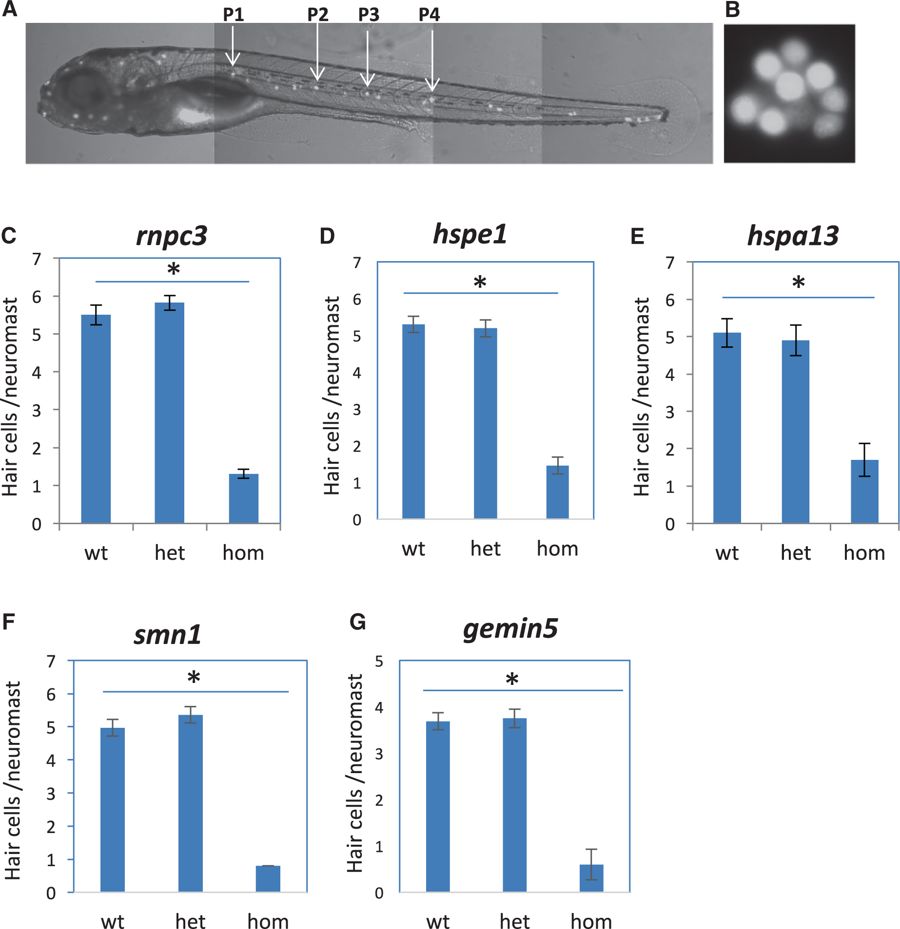
Fig. 3
Mutations specifically affecting hair cell regeneration. a A fluorescent image of a zebrafish embryo at 5 dpf stained with Yopro-1, showing the distribution of neuromast hair cells. Arrows point to the P1–P4 neuromasts that were used for hair cell counting. b A magnified image of neuromast hair cells in the P1 neuromast. c–g Quantification of impaired hair cell regeneration caused by rnpc3la028632 retroviral insertional mutation (c), hspe1hg77 (6 bp CRISPR deletion) mutation (d), hspa13hg78 (12 bp CRISPR deletion) mutation (e), smn1fh299 (ENU missense Y262X) mutation (f), and gemin5hg80(1 bp CRISPR deletion) mutation (g). The graphs are obtained from analyzing and then genotyping ~45 embryos generated from a pairwise incross of heterozygotes. Graphs show the mean and s.e.m. The difference between the wild-types and homozygotes is significant for all mutations (p < 0.05)